New customer: MM Kotkamills Boards Oy in Finland

We are delighted to welcome MM Kotkamills Boards Oy, our newest Wedge customer. After a successful pilot phase, they decided to continue to enhance their innovative board machine BM2 performance with the help of Trimble’s industrial data analytics system, Wedge.
“The Wedge process data analysis tool is a great step change for MM Kotkamills for a more systematic approach to improve quality consistency and faster troubleshooting. It’s easy to use, which enables a large group of people from engineers to operators to utilize the program.”
–Riku Suurnäkki, Production Director
MM Kotkamills produces ecological wood products, pulp, CTMP, saturating kraft paper, and fully recyclable barrier boards. In the first phase, Wedge will be utilized in board production. The annual capacity of the board machine is 400,000 tons of food-safe consumer boards that can replace plastics used in packaging.
We are hiring: Development Engineer in Finland
We are looking for a new member to our Wedge team in Espoo, Finland.
If you can see yourself as our new Development Engineer developing our process diagnostics system Wedge as well as Wedge related new applications, especially distributed Big Data acquisition, Storage and handling Tools and Applications, don’t wait too long but apply now.
TAPPI Journal article about utilizing Wedge
A peer-reviewed article about Wedge is published in the November issue of the TAPPI Journal. The article “Determining operating variables that impact internal fiber bonding using Wedge statistical analysis methods” is written by our valued customer, WestRock.
The article is for TAPPI members only, but the abstract is available for everyone.
Klabin expands its Wedge use
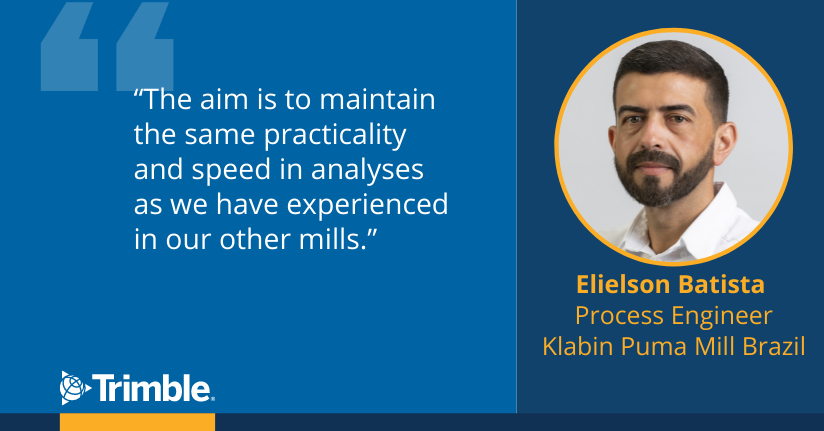
Klabin is expanding its Wedge use for its new mill site in Ortigueira, Brazil.
“The aim is to maintain the same practicality and speed in analyses as we have experienced in our other mills.”
– Elielson Batista, Process Engineer, Klabin
Klabin has been using Wedge since 2018. Features such as modeling, linear regressions, multivariate correlations with dynamic compensation of process delays have been in active use. Also, the flexibility to incorporate multiple databases in a single system has been valued.
“Wedge has facilitated quick responses and speedier support for decision-making. It has been especially valuable for discovering disturbances and identifying opportunities to optimize our processes.”
– Elielson Batista
The new Wedge deployment is part of the Puma II Project which is the biggest investment in Klabin’s history. Its operation is an important milestone in Klabin’s expansion cycle, which reinforces its capacity for sustainable growth combined with technology.
Make systems your servants

You might have encountered situations where the best way to work, based on your long experience and know-how, is not aligned with the systems in use. Systems that are supposed to help you work better. You are not the only one facing this issue.
Let’s take data analysis as an example. In theory, the process consists of the following steps: Defining the task, gathering data, cleaning the data, analyzing the data, drawing conclusions, and finally implementing the conclusions. But how often is the workflow that straightforward in real life? And, what if your system is built to follow the process strictly without any exceptions?
Which one is leading the way: Workflow or System?
Workflow is what people actually do: a sequence of tasks from start to finish. The ideal workflow is often described in guidelines, playbooks, and other process descriptions. In a work environment there are usually also systems, like ERP, CRM, a ticketing system, and a process analytics system, to help you follow the chosen process. In a perfect world, these are of course aligned, which saves time, resources, and your nerves.
But sometimes reality strikes back.
Process descriptions can be made without understanding workflows, and a workflow can be forced into a system that is not suitable for it.
When these are in conflict, workflow tends to win. People might pretend to follow the guidelines, and they might even do additional work to create the illusion that processes are followed to fulfill the system’s needs.
Systems should suit people’s needs, not the other way around
If systems don’t support actual work, people will find alternative ways to get the work done; and they can do it even if it’s strictly forbidden. This will cause extra work when people are pretending to follow the process and simulating things according to systems requirements.
When systems genuinely support the workflow, they make work easier, faster, and more efficient. Great systems excel in reducing routines and minimizing mistakes. They make people’s lives easier and happier, and employees and companies more productive.
But only when they serve the workflow. So, choose them wisely.
Wedge at your service
As you might have guessed, our process analytics system, Wedge, is a system that serves you. It doesn’t make you follow its way of thinking and the theoretic process, but flexibly accommodates your needs and your mindflow.
We understand the true nature of data analysis: Sometimes you skip the data cleaning step, rush into the analysis, and need to clean the data later. Often you realize that critical data is missing from the analysis and want to add it later. Maybe you get sidetracked for a while as your analysis process has exposed something new that you want to dive into. This is totally ok!
Wedge is the servant for your process analytics needs. You are the Master.
 Want more insights?
Our sales team is full of data analysis experts ready to help you. Learn more about Wedge industrial data analytics tool.
Wedge on LinkedIn – follow now!

LinkedIn now has a brand new page dedicated to Industrial Data Analytics. We warmly welcome you to follow the page! On this page, you’ll be the first to hear about the latest Wedge news, but we’ll also share interesting articles related to process analytics more broadly.
Paper Technology professionals visit on the Paper Safari tour
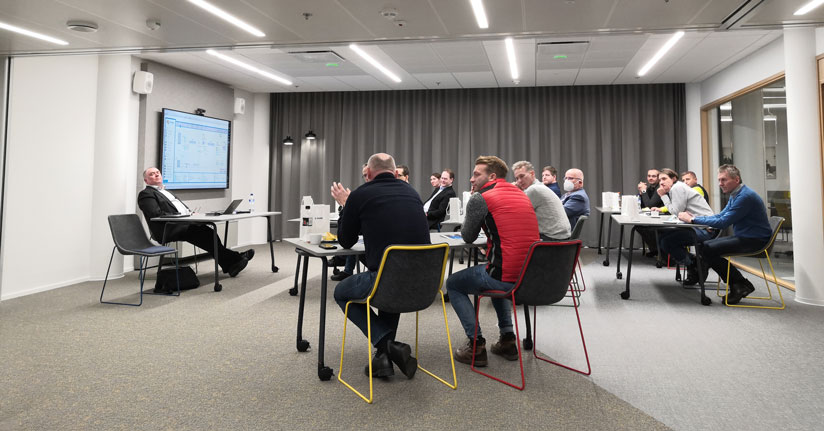
We had the pleasure of hosting a group of Paper Technology professionals from DACH area on their Paper Safari tour in Finland. Our process diagnostics system Wedge is of great interest especially to engineers working in the paper industry.
The Paper Safari is organized by The Association of Pulp and Paper Technology Finland.
Paper360°: “Digitalization Rolls Out at DS Smith Mills Across Europe”
An open mind takes you to the next level in process analytics

As a wise old man once said: You can prove anything with facts. Okay, it was Homer Simpson, but you have to admit, he has a point.
You need data to make data-based decisions, but the challenge is that the more data you have, the easier it becomes to misuse the data to serve the conclusions you want to draw. With large data sets and good tools, it may even be deceptively easy to do so.
When the data set is large, it is time-consuming to point out weaknesses in the analysis. And even if you do so, it might be too late to change anything, if actions have already been taken.
The ideal data processing workflow
If you are looking for genuine and sustainable improvements, the data processing workflow starts with an open mind. The ideal workflow looks like this:
- Ask open questions
- Collect data
- Refine data
- Analyze
- Diagnose
And these steps need to be repeated several times to test different scenarios. Only then it is time for conclusions and decisions.
Doing high-level data analytics requires courage
This way of working requires some bravery, since results and facts can be ugly, unpleasant, or unwanted. To stay on track, you also need high morals and ethics. And you do want to stay on track, don’t you?
Want more insights?
Our sales team is full of data analysis experts ready to help you. Learn more about Wedge industrial data analytics tool.
DS Smith partners with Trimble to drive digitalisation at its paper mills
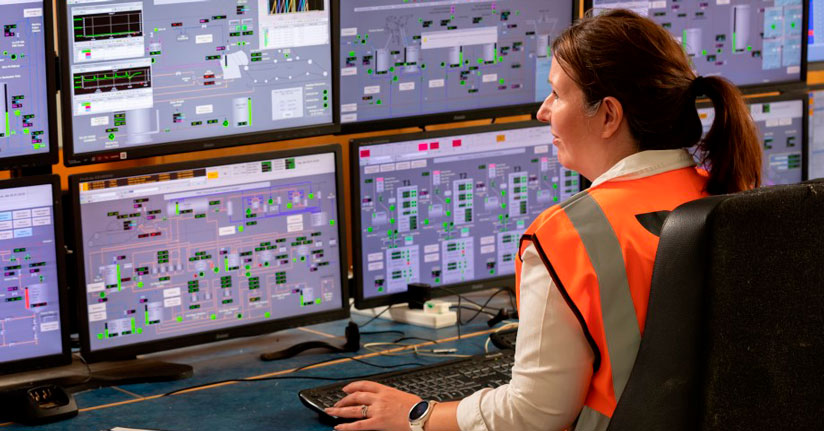
Following a successful trial, DS Smith has adopted Trimble’s powerful data mining platform, Wedge, at their paper mill in Kemsley in Kent – the largest mill for recycled papers in the UK.
“Through the Wedge platform, our mills can quickly resolve problems as they occur with fast and focused problem-solving tools. Ultimately, the benefits are seen in operational efficiencies, product quality and output but also in the employee experience.”
– Guy Lacey, Next Generation Technology Director at DS Smith