Visualize process and quality data
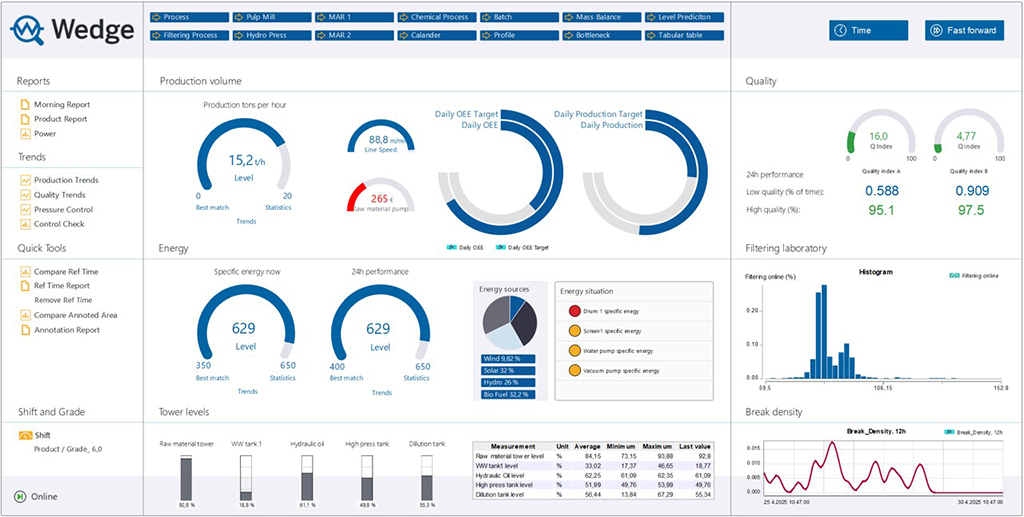
Typically, process and quality data are scattered across several data sources. This often leads to a need for time-consuming collection of data before any process analyses can be conducted. Furthermore, the findings may be compromised if a full set of data is not available. With Wedge, you can see the full process and data flow, from all data sources, online and in one place.
All data online, with one tool
Wedge brings all process and quality data together in the same tool. The data always retain the full history, enriched with current online data. Thanks to this approach, a user can easily start analyzing and diagnosing the process with a comprehensive set of data, at any time. There are no blind spots: the analyses cover all the data.
Wedge can connect to any sources of process history; automation systems; and other data sources, such as LIMS, MES, and ERP systems. Hundreds of production sites, with many kinds of IT architecture, are satisfied users of Wedge.
Fast, convenient use
Wedge is very quick to operate. This is essential for a convenient user experience and one of the most applauded features of Wedge.
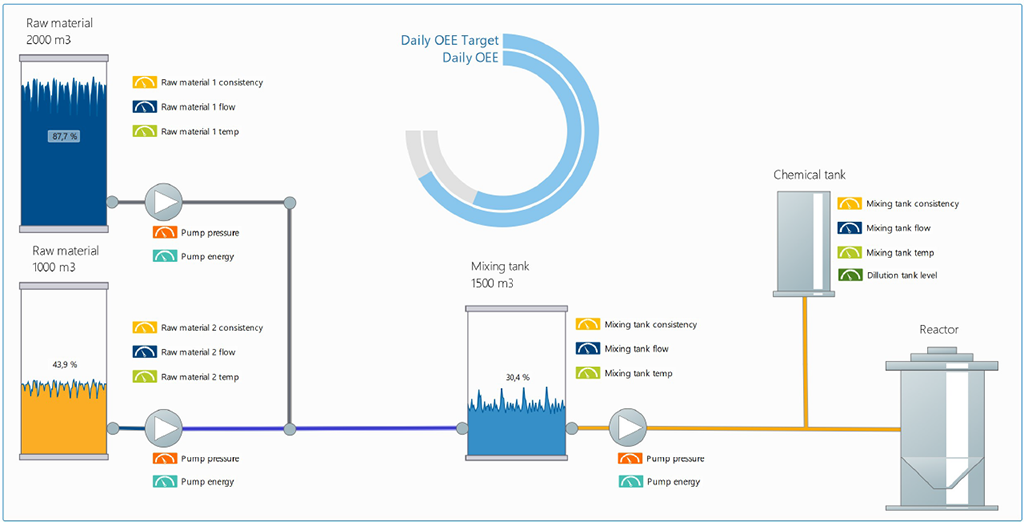
Customized process diagrams & dashboards
Diagrams in Wedge are composed from online measurements and graphical elements. With online measurements as the “beef,” graphical elements put everything together in the “bun,” helping the user contextualize the data.
Typically, certain common views are made available to all users. The role of these shared views is to create a solid overall visualization of the data and process, provide a platform for analyses, and enable knowledge-sharing. Trimble’s experts help the customer build the first views, after which customers can modify and add views without external assistance.
Another widely used feature of Wedge is ad hoc diagrams. When facing process issues or wishing to investigate process behavior, a user can create a tailored diagram in seconds.
Wedge has a built-in library of graphical elements available, for smooth visualization. Also, a copy-and-paste approach is possible. Furthermore, all measurements (setpoints, controller outputs, and process values), from all sources, are listed in one place and can be added via drag-and-drop.
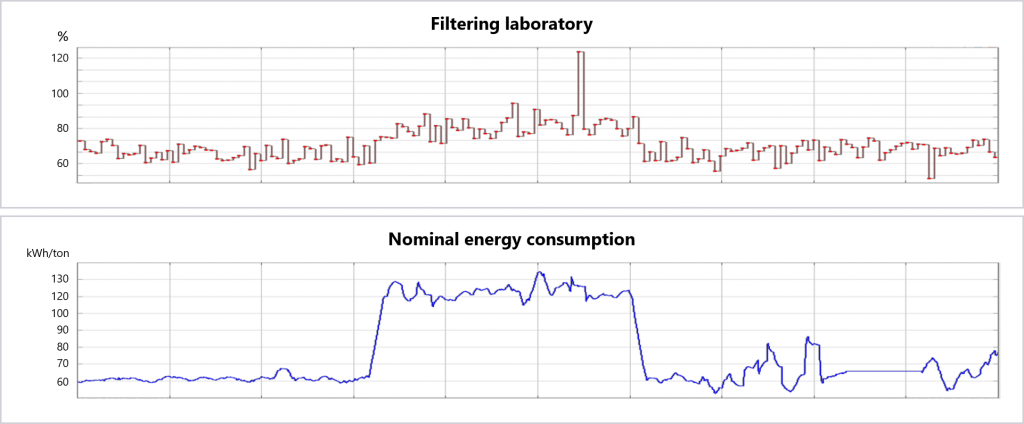
View, combine and analyze data in seconds
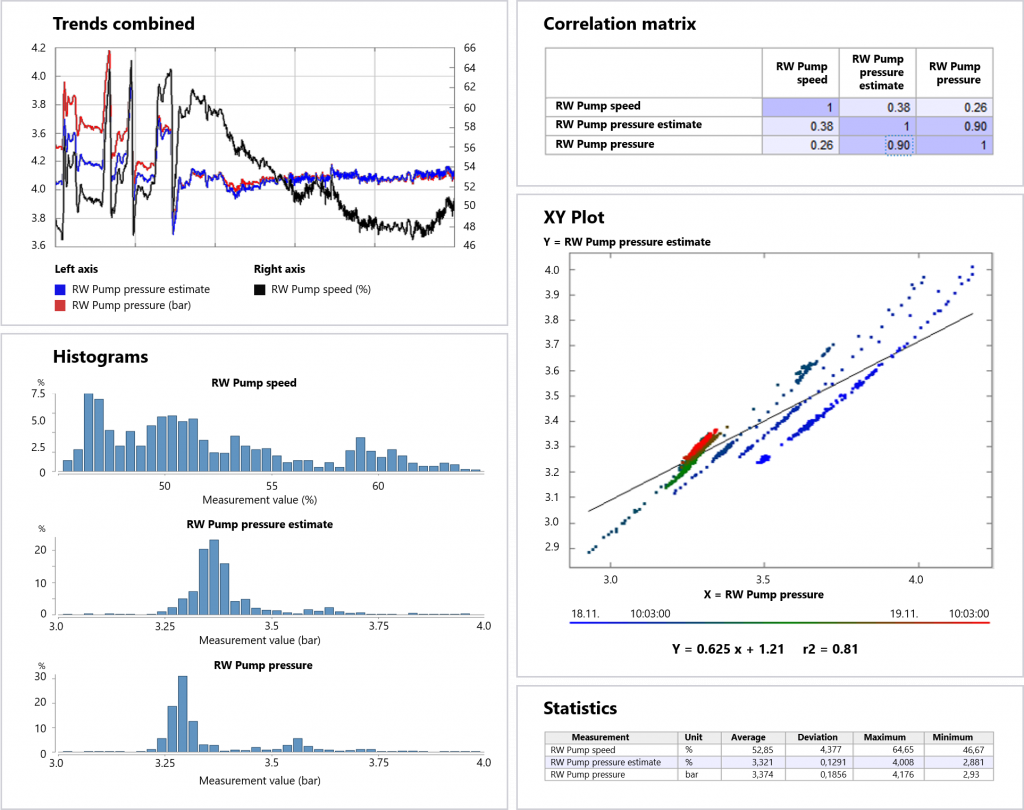
There can be any number of trends and views open at the same time. All views are seamlessly synchronized and reflect the same time selection and data-cleansing, so it is easy to examine changes and learn more about the process.
Read more about analysis features >>
Want to learn more? Contact our sales team