Multivariate tools for extreme use
PCA modeling
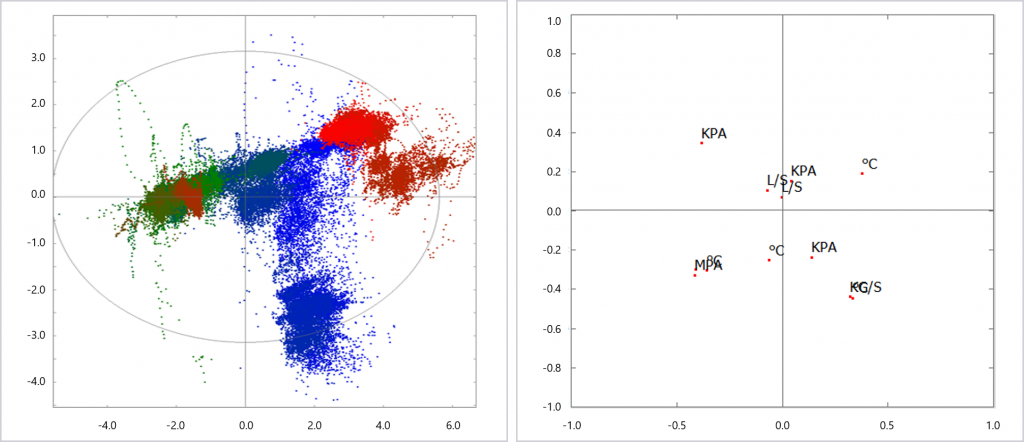
The data contained within a vast number of correlating measurements can be expressed with a smaller number of calculated variables than the original signals have. Principal component analysis (PCA) can be used to compress the data.
The aim is to express the original information with the new variables while retaining as much information as possible. This is possible even though the number of the new variables is much lower than that of the original ones. The PCA process can reveal hidden multivariate correlations that normal correlation-analysis methods are not able to identify.
Any abnormal behavior evident from the new, compressed variables can be studied further in Wedge: The tool can reverse the PCA compression process and reveal candidates for the root cause of the change.
PLS modeling
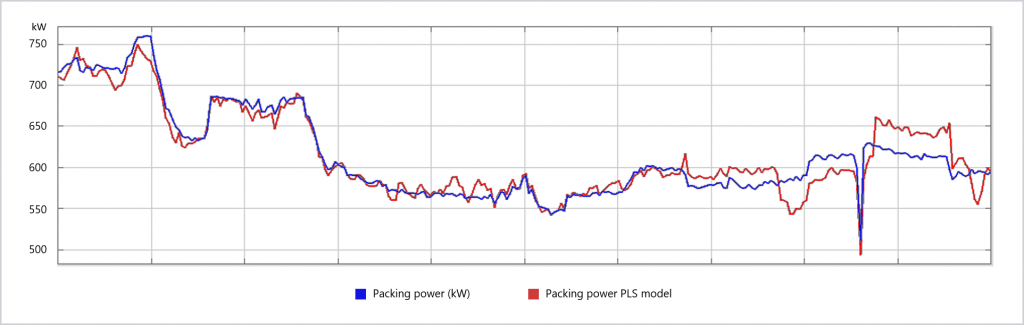
PCA components can be used as input to linear estimation of any process variable. The approach is known as one-variable PLS modeling.
A PLS model can be used in, for example, modeling of laboratory data on the basis of process data. This allows a customer to obtain quality information immediately when online measurements are not available. Another common use is for duplicating process measurements: the PLS model enables verifying measurements’ reliability as is done in the illustrative picture below.
MAR modeling
Periodic fluctuations in processes can result from such factors as poorly tuned controls, malfunctioning valves, variations in raw-material quality, and seasonal or day-to-day variations. A process often experiences several simultaneous disturbances. It is not unusual in controlled systems for a given fluctuation to be manifested at several points, throughout the process. Process fluctuations can, for example, reduce productivity and the quality of the end product.
The MAR Navigator tool is used to determine the origin of process fluctuations. MAR Navigator’s operation is based on multivariate auto-regressive modeling.
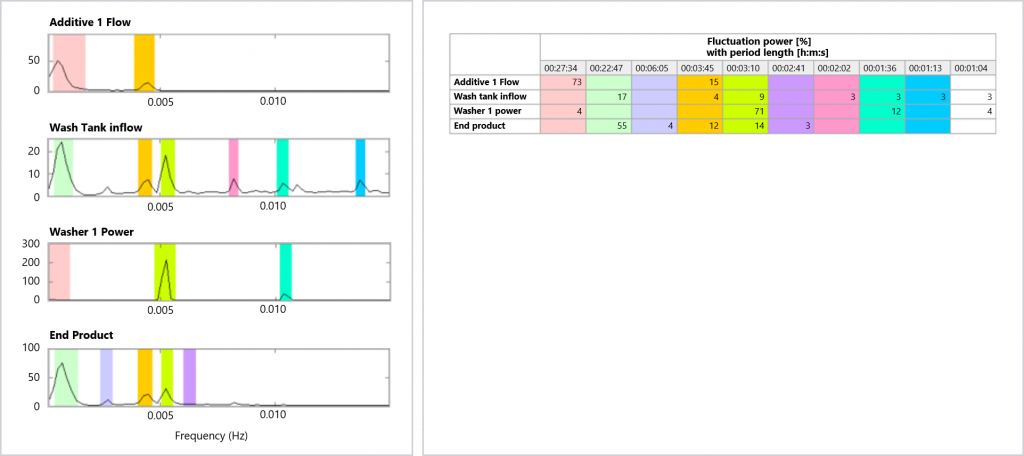
Learn more about Spectrum analysis >>
Want to learn more? Contact our sales team!