Dynamic process-delay compensation
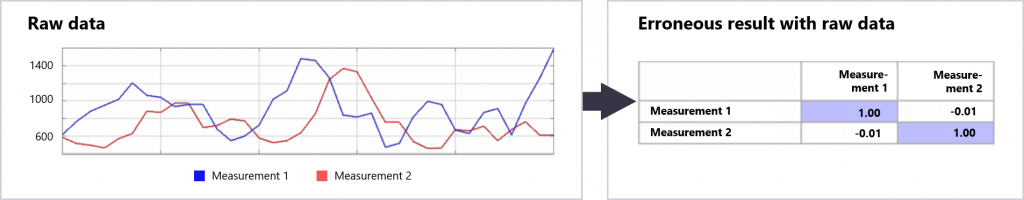
All production processes contain delays (or lag, if one prefers that term). Depending on the type of process, the delay might be anything from milliseconds to months. Common for delays of any length is that, when they are not compensated for, they compromise analyses. Compromised analysis may lead to erroneous findings or not detecting critical root causes or consequences.
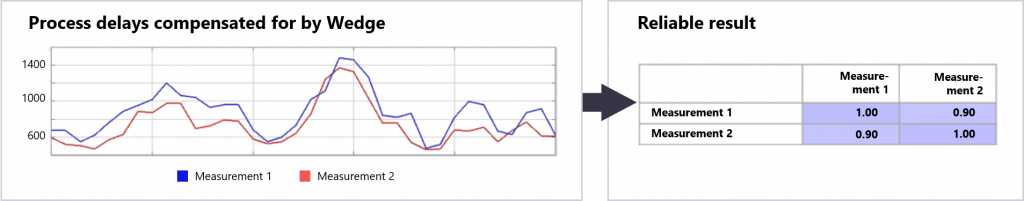
Using a simple dynamic time-delay model, you can teach Wedge to compensate for delays: When Wedge knows which process stages are connected to which measurements, the analyses/diagnoses can be automatically adjusted accordingly. This guarantees that all analysis results are of high quality and reliable.
The tool uses delay models
A delay model in Wedge is composed of delay components. The model is built in drag-and-drop fashion by means of ready-made building blocks. Dynamic delay components might include, for example, pipe delays, tank delays, and external delays, whereas constant delays are found with static components. The user can easily link measurements to the delay groups and teach process dynamics to the delay model.
In dynamic compensation for delay, the tool takes flow, speed, volumes, surface level, and mixing into consideration and calculates the relevant delay on the basis of current process conditions. The tool can even cope with conditions in which there is a split in the process and the portions join further along in the process.
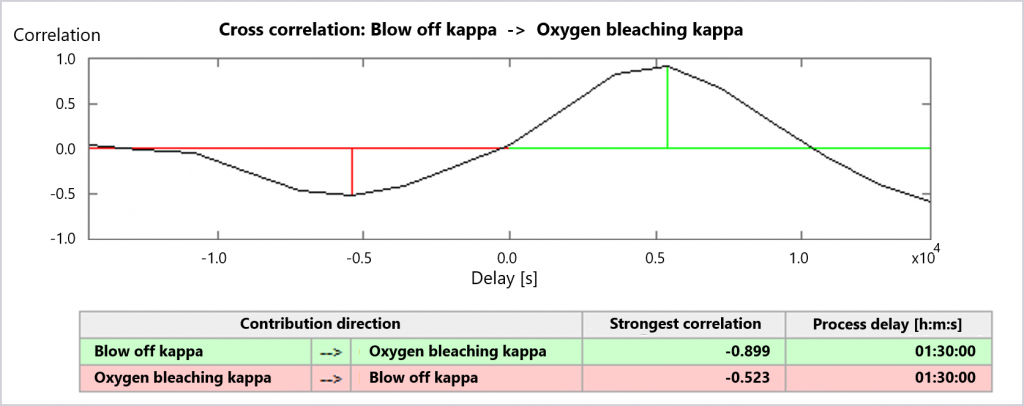
Cross-correlation helps to determine delay between measurements
Thanks to the cross-correlation feature, a user can determine the delay between two measurements with the system’s assistance. Wedge calculates the delay value for which the correlation between the measurements is the highest. This information can be utilized in creation of the delay model.
A virtual tracer enables following the raw material through the process
Once the delay model has been created, a user can add a virtual tracer to the process. With this, the system shows material flow through the process.
In the diagram below, the first trend curve shows stepwise change in the raw-material feed. The blue highlighting indicates the point at which the change in raw material reaches each measurement location. The process flow splits in two and comes back together, with the delay differing between the branches. This is visible in the final graph, where the tracer appears in two phases.
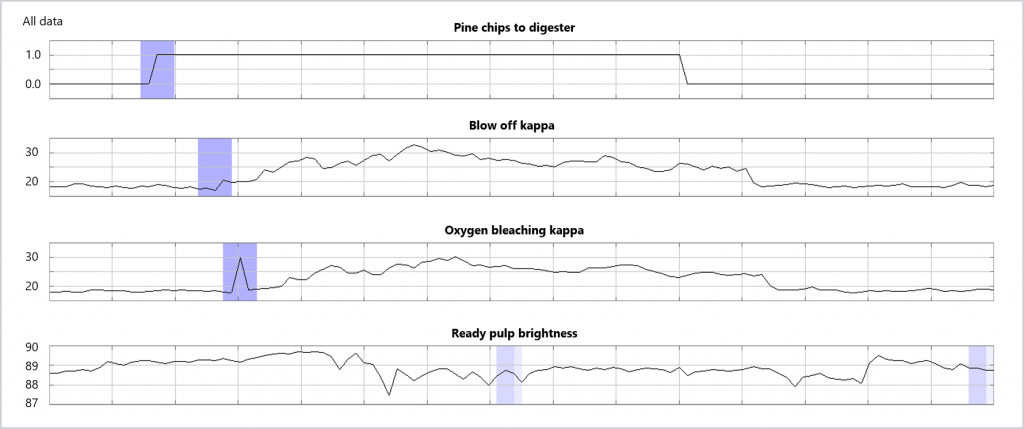
The virtual tracer feature aids in investigating cause-and-effect relationships. When flow of change is presented graphically, in a user-friendly manner, it is easier to perceive whether two events might be related.
Some operators use Wedge in online mode, following how a change makes its way through the process. This helps operators react to change in specific parts of the process at the right time.
The tracer can even reveal whether process equipment is not in top condition: if flow through the process is more rapid than usual, this usually is indicative of lower effective volume of pipes or tanks.
An end-product recipe lets you study what conditions the end product has experienced
In addition to their value for high-quality analyses, delay-compensated measurements are a handy means of examining the history of a specific production batch – such as a roll, coil, or shift/day’s production.
This can be hugely beneficial when, for example, one is handling a customer claim and following up on it. The user can select the end-product completion or dispatch time on the time axis and see what process conditions the batch in question actually experienced.
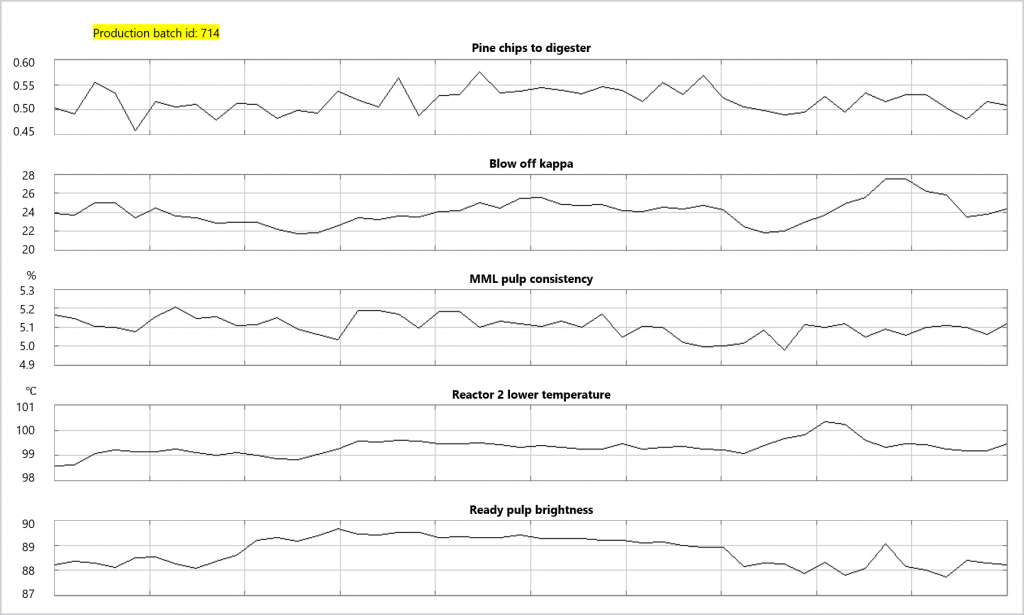
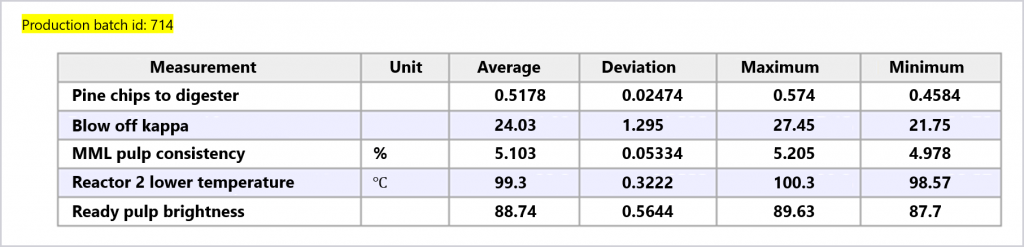
Furthermore, it is possible to utilize the Wedge statistics feature to check the process conditions of the production batch of interest. The batch-specific process conditions along the entire production line are synthesized into a single view.
Want to learn more? Contact our sales team!