Analyzing & diagnosing 2D profiles with process data
Wedge Profile Edition is typically used to analyze sheet- or plate-like products, such as paper or rolled metal. The data material analyzed is in vector format and typically produced by profile scanners. With this add-on tool, the customer gains the power to examine changes in properties and profiles: shape, thickness, flatness, weight, smoothness, moisture, and other variations.
The system can analyze profile data in connection with process measurements, to uncover the root causes and consequences of even subtle profile changes.
Handling 2D-profile map data in the same way as any other data
Graphical 2D-profile maps represent the typical approach to visualizing scanner data. While these maps may enable identifying the most significant quality problems, long-term changes such as gradual shifts cannot be detected through visual monitoring alone.
With Wedge Profile Edition, however, the data behind 2D-profile maps can be handled in the same way as any other data. All standard data-handling functions are extended to profiles, including time-period selection, cleansing, and focusing based on process state (type of end product or raw material, etc.). In addition, all calculation methods can be applied to profiles also, which enables such operations as calculating the change in the profile between two measurement points and studying the change.
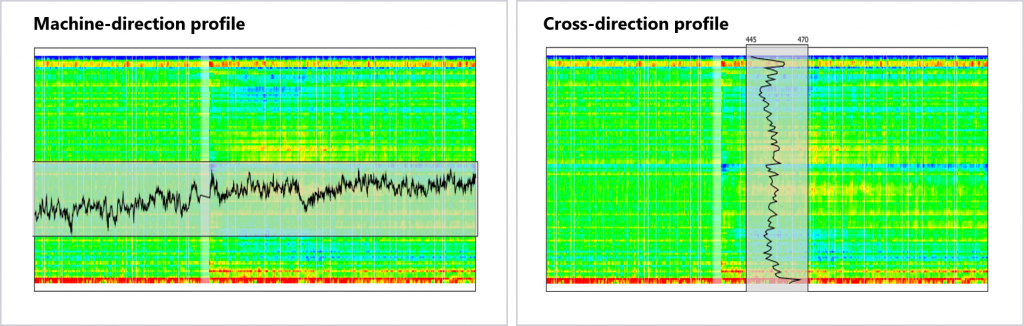
Profile scans can be viewed in detail both along the production line and in the cross‑direction.
Analysis and diagnosis alongside any other data
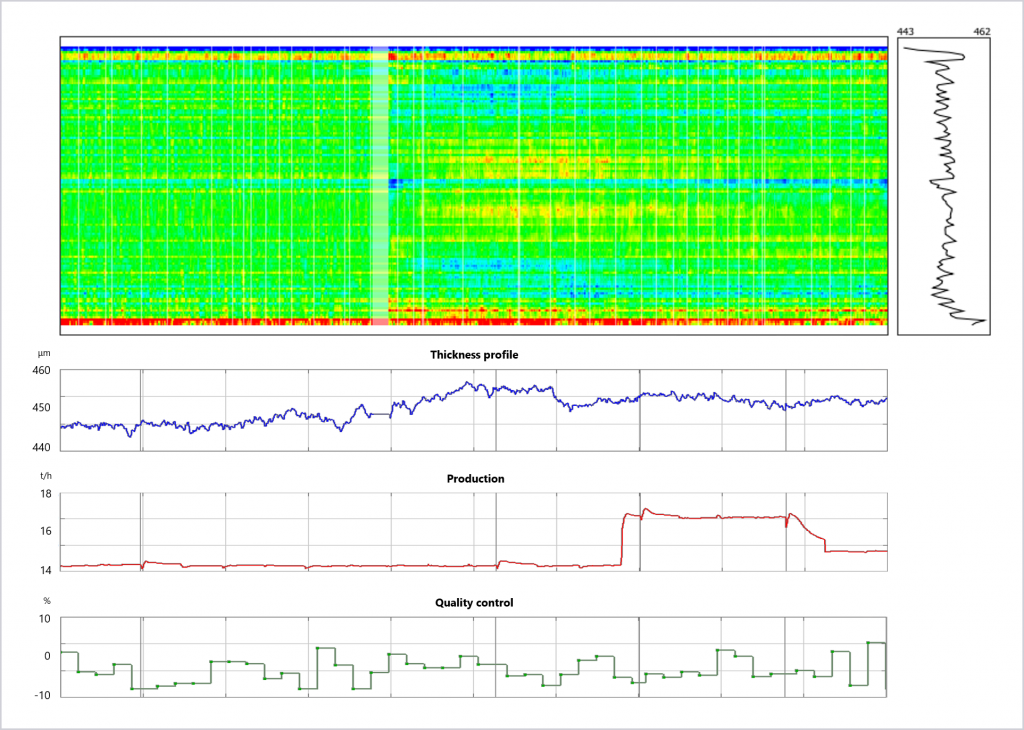
Wedge Profile Edition is able to show profile maps alongside regular process measurements.
Furthermore, the system can analyze profile data in connection with process measurements, to uncover the root causes and consequences of even subtle profile changes.
A real-life example: Root-cause diagnosis for profile shape
Wedge can convert any cross-directional 2D profile into a 1D index, which allows utilization of the tool’s analysis and diagnosis tools. The 1D index can be any quantity that describes the characteristics of a 2D profile, such as U shape, W shape, skewness, or kurtosis.
In the example below, the thickness profile is complemented with an index for W shape that measures (as the name indicates) the W shape of a cross-direction profile.
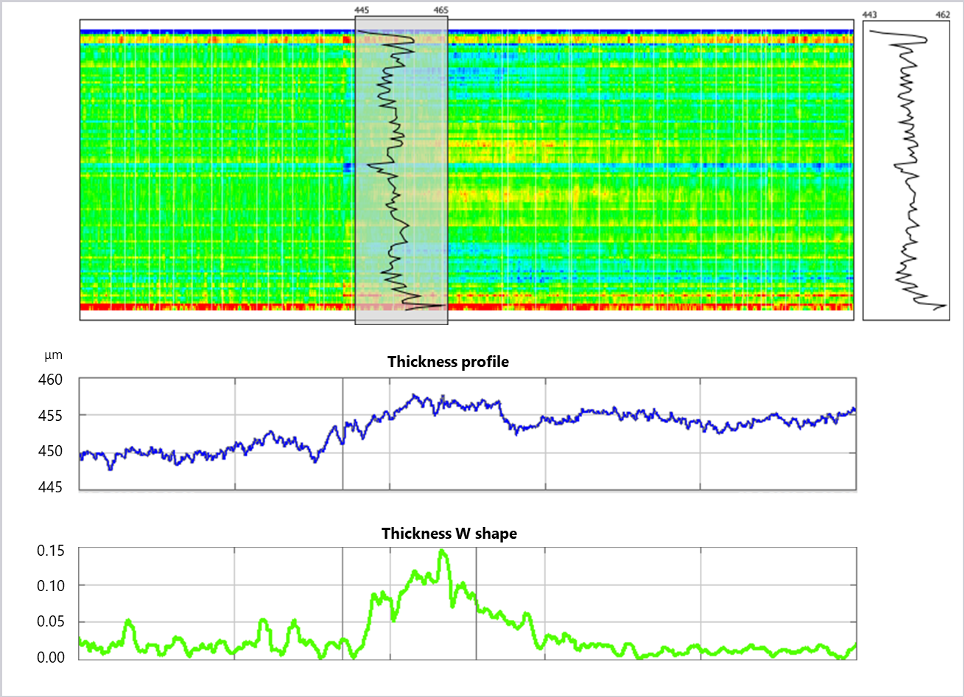
In this example, the W shape index increases for a portion of the observation period. With Wedge the user can trace the root-cause candidates for the undesired profile change: The user may ask the tool to find signals that correlate with the W shape change.
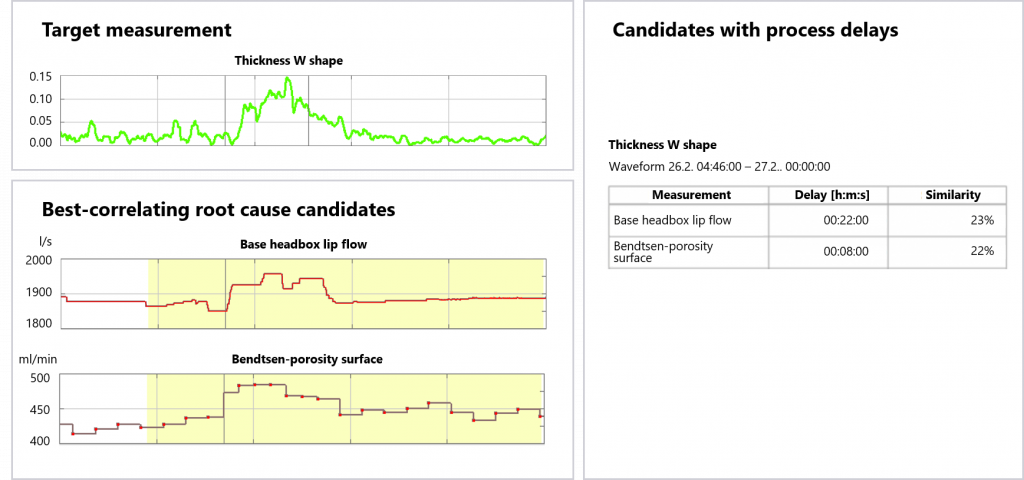
The image below presents the findings: Wedge proposes that thickness W shape might be related, for example, to an increase in the “base headbox lip flow” value and in “Bendtsen-Porosity surface.” At this point, the process engineer adds process knowledge to the picture for interpreting the results and drawing the appropriate conclusions.
This example is a case from real life. Here, an increase in lip flow was found to be the underlying cause for the transient change. The data revealed that headbox lip flow increases 22 minutes before the occurrence of the W shape. While “Bendtsen-Porosity surface,” in turn, is a quality index that correlates with W shape, this is a consequence of the lip-flow factor.
Want to learn more? Contact our sales team!