Billerud Gävle selects Wedge
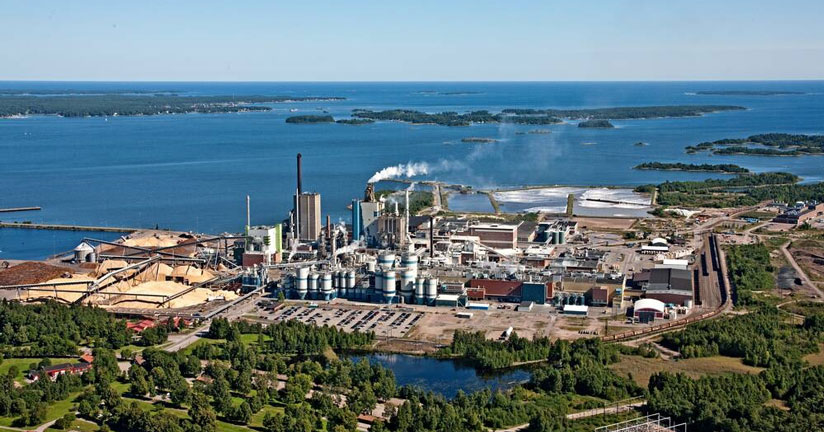
Billerud’s production unit in Gävle, Sweden, renowned for producing liquid packaging board and white-top liners for food-proof packaging solutions, has chosen Wedge to support consistent quality and efficiency in its operations. After a successful pilot phase, Billerud was convinced of the Wedge benefits and capabilities, leading to a long-term agreement for its use.
Billerud is a leading provider of sustainable packaging materials and solutions. The decision to implement Wedge at their Gävle mill is a way to leverage advanced technology to ensure high process efficiency and product quality, meeting customer demands on runnability and printability in the conversion processes, as well as the functionality of the final packaging solutions.
Wedge‘s powerful analytics and real-time monitoring capabilities will support Billerud in optimizing its production processes, reducing variability, and enhancing overall product quality.
We are excited to partner with Billerud and contribute to their mission of delivering superior packaging solutions.
Join us at two key industry events in July
We are excited to present Wedge at two significant industry events this July. Join us at Zellcheming in Wiesbaden, Germany, from July 1-3, and Congresso Nacional da Bioenergia in Araçatuba, Brazil, from July 1-2.
At Zellcheming, Matti Häkkinen will deliver a presentation titled “Dynamic vs. Systematic: Exploring Data Analysis Strategies in the Pulp and Paper Industry” on Wednesday, July 2, from 10:10 to 10:30. This session will explore various approaches to data analysis within the pulp and paper sector.
Simultaneously, at Congresso Nacional da Bioenergia, Alan Oliveira will present “Aproveitamento de dados industriais: Transformando dados fragmentados em vantagem competitiva” during the Industrial panel. This presentation will focus on leveraging industrial data to create competitive advantages.
We look forward to meeting you soon!
Let’s meet at TAPPICon 2025 in Minneapolis!
We are thrilled to announce our participation in TAPPICon 2025, the premier conference for sustainable forest product producers, taking place in Minneapolis, MN, from May 4th to May 7th, 2025.
Our team, including Teemu Möykkylä and Matti Häkkinen, will be there to showcase Wedge, our powerful tool for process data analytics. Wedge is designed to help you make the most of your process data, driving efficiency and sustainability in your operations. Whether you’re looking to optimize performance or gain deeper insights into your processes, Wedge is the solution you need.
We also welcome you to join us for an insightful presentation by Teemu Möykkylä on Tuesday, May 6th at 9:20 AM. He will be presenting “Innovative Data Analytics in the Pulp and Paper Industry: Balancing Ad-Hoc Insights with Automated Consistency.” This presentation is part of the session “Unlocking the Power of Advanced Data Analytics: Techniques and Practical Strategies for Successful Implementations.” Don’t miss this opportunity to learn about cutting-edge data analytics techniques that are transforming the pulp and paper industry.
Let’s meet at TAPPICon!
Let’s meet at Paper & Tissue One Show in Abu Dhabi!
Trimble Wedge is exhibiting at Paper & Tissue One Show, the premier global paper and tissue industry event. Paper & Tissue One Show will take place in Abu Dhabi from January 21 to 23, 2025.
At Paper & Tissue One Show, you can meet our process data analytics experts Matti Häkkinen, Jürgen Missel, Holger Wagner and Teemu Möykkylä to discuss whether Wedge could be the system for your process improvement.
See you in Abu Dhabi!
Now available: Wedge 10
We’re pleased to introduce Wedge 10, the latest upgrade to our process analytics tool.
Wedge 10 offers:
- A new Web browser interface for viewing dashboards and trends
- An expanded collection of dashboard gauges and diagram components
- Improved diagram editing tools
In addition, the update brings numerous other features and usability improvements to make your work easier.
Curious to see what Wedge 10 can do for you? Contact wedgesales@trimble.com to get started.
Harnessing industrial data: Turning fragmented data into competitive edge

The amount of data collected from industrial processes is increasing at an accelerating speed. Modern computer systems allow data to be stored over long periods of time and at a much faster sampling rate than ever before. This raises an important question: What do we do with all this data?
BtoC companies have been successfully collecting and analyzing large and complex customer transaction data for several years. This ‘big data approach’ aims to give them a competitive edge over their rivals. Industrial BtoB companies are not at the same level yet, but the ever-increasing competition forces them to fine-tune their manufacturing processes. Companies are forced to produce better quality in larger amounts and, at the same time, reduce energy consumption and raw material costs.
These problems can be solved by allowing employees to improve manufacturing processes based on measured time series data.
By applying efficient data handling methods and tools, industrial companies can unearth the untapped potential in their existing data, leading to improved process diagnostics and a competitive edge.
Challenges of utilizing fragmented data
During the last decade, digital information, process control and business execution systems have become standard applications in the pulp and paper industry. At the same time, the amounts of data collected and saved have increased significantly, and this trend will continue in the future.
Mills’ systems are typically focused on either a limited process area (e.g., raw material handling, stock preparation, reel section) or a limited data type (e.g., control loop data, process data, quality data and cost data).
Today, huge amounts of data are collected, but only a minor part is utilized. A production plant or an entire company would achieve huge benefits if all this data were combined seamlessly, and the employees would get a total view of the process.
Combining domain expertise with efficient data management
The collected data mass contains a lot of unused business and process improvement potential. To harness this potential, an efficient data handling system is needed.
An efficient data management system enables the combining of all data sources into one system. A user-friendly user interface supports the user in getting useful information and knowledge from that huge amount of data. The user shouldn’t need to spend much time getting data into the data handling system; instead, they should just focus on troubleshooting the problem, increasing efficiency or improving the end-product quality.
Relationships between process phenomena are very complicated, and several measurements affect each other. Therefore, there is often a need to combine original measurements into new and more useful measurements, e.g., to calculate dry solid flow based on original flow and consistency measurements. To enable this type of free data modification, there must be an easy way to add one’s own calculations to the data handling system.
Data analysis process: A system-driven workflow or human-driven mindflow?
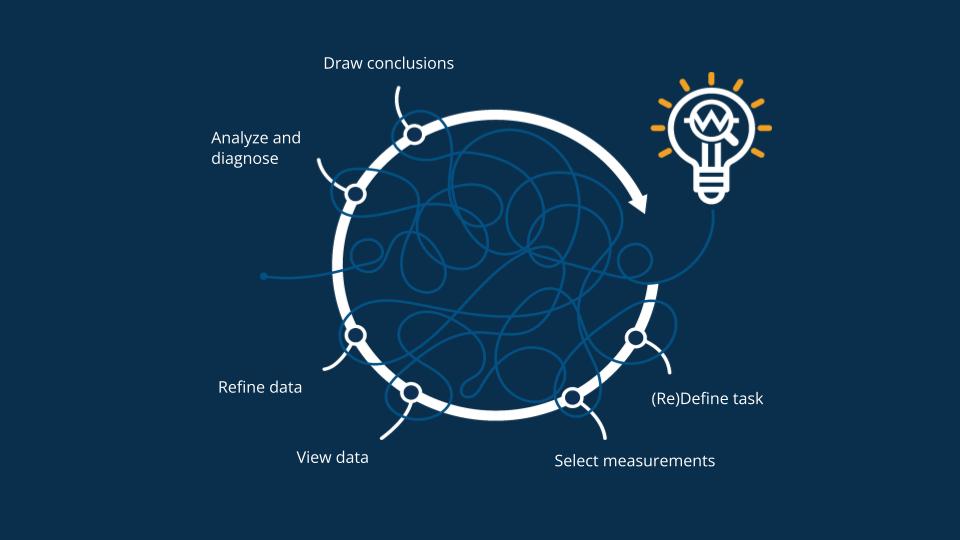
Process analysis can be started when all relevant data is available in the data handling system. Picture 1 illustrates the simplified process data analysis or troubleshooting cycle workflow.
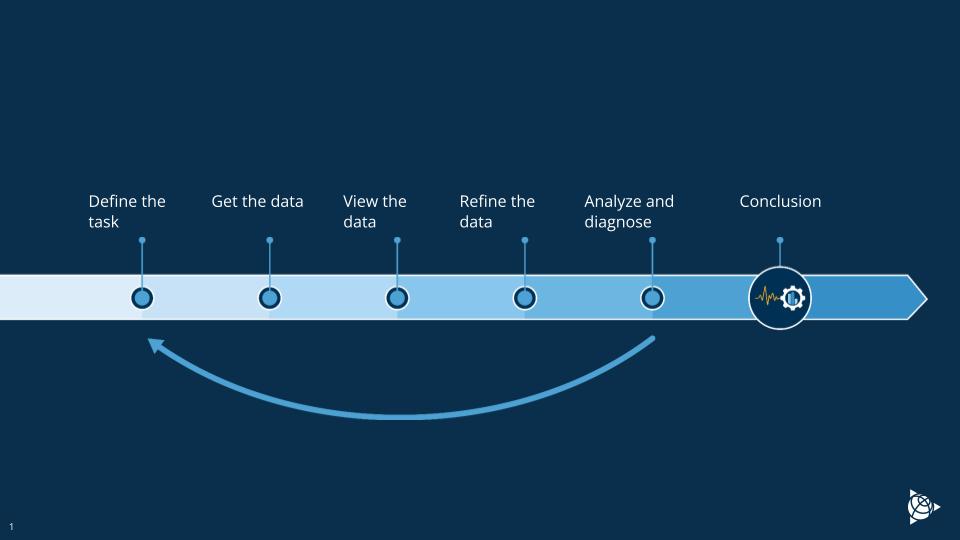
The first step is to define the target: what do we need to find out?
The next step is to create a working set of measurements. At this point, combining data from different sources into one system is important. The data connection should be online to avoid laborious and slow data imports into the analysis system. Data should also be close to real-time to enable fast reactions to situations that appear.
Process data always contain some bad values, e.g., huge outlier values, erroneous values, and shutdown data values. This type of bad data affects the analysis results a lot, and therefore, those values must be removed before analysis. To perform this kind of data cleansing efficiently, the tool should support the user’s process knowledge. An experienced employee with process knowledge is the best at judging which values are irrelevant, and then those values should be able to be removed easily from the dataset.
When data is cleansed, the user can perform process analysis, e.g., statistics and correlation calculations. In this step, it’s typical that the user already finds some useful information from the data, but when there are many measurements, this can be laborious. Computer power can be used to make this step much more efficient. A computer can quickly check many process and quality measurements to determine which correlates best with the set target. The system should be able to rank the measurements and give a candidate list of measurements that seem to affect the most to the target measurement. In this step, the data is turned into information.
It’s important to remember that the user must have good process knowledge to get useful study results and make reliable conclusions. In this step, the information is turned into new knowledge. If needed, the user can redefine the task and start the loop again.
In real life, a good and efficient data-analysis workflow is not linear and simple as described above; it looks more like a spaghetti ball.
New information and insights inevitably emerge when data is processed through creative cleansing, refining, calculations, and analysis methods. This guides data analysis forward. Often, these new insights result in redefining the original question.
In an efficient data analysis workflow, new insights are created in all steps. Data analysis systems should support this agile and creative work style. Users must be able to modify the dataset, try different data cleansing scenarios, and try different analysis methods agilely.
Better use of data to address productivity and sustainability challenges
While the amount of data is increasing at an accelerating speed, the resources in the mills are decreasing. The competition between companies and mills is tough, and the situation will not be easier in the future. In addition to all this, the importance of saving natural resources is also rising.
This forces companies to run processes more efficiently and sustainably. One of the most cost-efficient ways to achieve the targets is to utilize existing data more efficiently.
Nowadays, mill personnel are required to handle many different tasks simultaneously. This means that they can’t spend much time on data management. An efficient and intuitive tool is needed to combine all relevant data in the same view. The user with good process knowledge must be able to get answers from the system to process problem questions quickly and easily.
 Want more insights?
Our sales team is full of data analysis experts ready to help you. Learn more about Wedge process data analysis tool.
Let’s meet at MIAC 2024!
Trimble Wedge is sponsoring MIAC 2024, the number-one event for the paper and packaging industry in Italy. MIAC will take place in Lucca from October 9 to 11, 2024.
At MIAC, you can meet our process data analytics experts Matti Häkkinen, Jürgen Missel, Holger Wagner and Teemu Möykkylä to discuss whether Wedge could be the system for your process improvement.
Mark your calendar: MIAC Tissue Conference – Session 1 on 9 October 2024 at 15.50. That is when Mika Suojärvi will give his presentation: Finding answers to questions by using process data.
What I talk about when I talk about data analysis

Inspired by a book by Haruki Murakami, the title sums up well what often plagues the data analysis debate: we often find ourselves discussing disparate concepts. Some view data analysis as reporting, while others relate it to modeling or calculations. Some people discuss visualization, and some see it as finding answers from data. We value all of the abovementioned elements. Still, we believe that the true essence of data analysis lies elsewhere, and human creativity is the key element.
In this article, we will present our perspective on this subject. We are not suggesting that other definitions are incorrect, but it’s essential to define precisely what we mean when discussing data analysis.
What is data analysis? Our definition
Data analysis takes on various definitions; ours is as follows: Data analysis is when you use creative data processing methods to uncover answers to novel questions or to provide explanations for unfamiliar scenarios.
Data analysis can be helpful in situations you don’t know the answer and it cannot be predicted.
Next, we want to break this definition into smaller parts and specify the creative data analysis components.
The elementary components of creative data analysis:
1. Ask new or random questions
A new question is one in which a ready-made model or answer is unavailable. For example, if something is happening for the first time or the environment has changed, we face a new challenge.
If the same question arises repeatedly, creating an automated system that can provide the answer may be more efficient. This could be a reporting system, an automation system configuration, or something else.
2. Collect and refine the data to find the answer
Collect data with an open mind and in manageable amounts. Attempting to gather all data is not feasible and will likely result in drowning in data. On the other hand, limiting the raw data to the obvious will not lead to new insights.
Raw data includes all available information but is mostly useless without cleansing. Data must be refined to reveal meaningful characteristics to find answers to specific questions. The refinement process depends on the question and the raw data’s nature.
When we want to find answers to random questions from unknown data, analysis requires a creative element to be successful, as predefined sequences often do not work well enough in new situations.
3. Learn along the way
New information and insights inevitably emerge when you process data through creative cleansing, refining, calculations, and analysis methods. This guides your data analysis forward. Often, these new insights result in redefining the original question. For instance, we once participated in a project to reduce production costs. However, the result was increased production speed and yield, breaking production and efficiency records.
4. Let the data speak for itself
Owing to the creative refinement process, the answers obtained through data analysis are often unpredictable. Meaningful data analysis requires domain knowledge, and analysts tend to have their favorite methods of data refinement, which can sometimes lead to biased thinking. A smart data analyst lets the data speak for itself and provide the information it holds. In contrast, poor analysts may manipulate the data to support their preconceived assumptions and hypotheses.
Data analysis is an enabler; creative humans bring value
Curious and creative individuals who enjoy seeking solutions to complex questions are valuable assets to any company and can’t be ignored when looking for the payback of any data analysis work and system. Data analysis alone provides no payback or value; it’s an enabler.
The value is generated when you use the results from creative data analysis to change human operations, reconfigure automation systems, modify recipes, etc. The outcomes and results of creative data analysis are unpredictable as they find answers to random questions. Despite this, data analysis is critical to every company’s success. With creative data analysis, you can gain new insights and make better and more accurate decisions faster.
Want more insights?
Our sales team is full of data analysis experts ready to help you. Learn more about Wedge process data analysis tool.
Formica expands its Wedge use to Spain
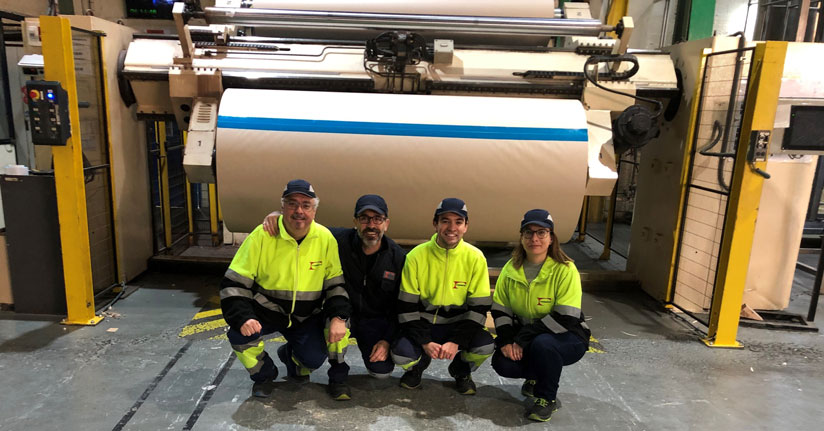
Formica’s factory in Valencia, Spain, has taken a major step towards full digitalization by acquiring Trimble’s process analytics tool, Wedge.
Formica’s mill in Finland has used Wedge since 2023, and their excellent experience made it an easy choice for the Valencia team.
“Wedge is a powerful piece of monitoring and analysis software, and it will help us reduce variability in our processes. Wedge training has been of high quality, and we have already learned a lot about making better use of our process data,” says Jose Luis Escobar Palomares, production manager at Formica Valencia.
Formica Group is a leading provider of branded, designed surfacing solutions for commercial and residential customers worldwide. Formica is the largest manufacturer of High Pressure Laminate (HPL).
Wedge improves the use of process data in Europe’s largest nuclear power plant
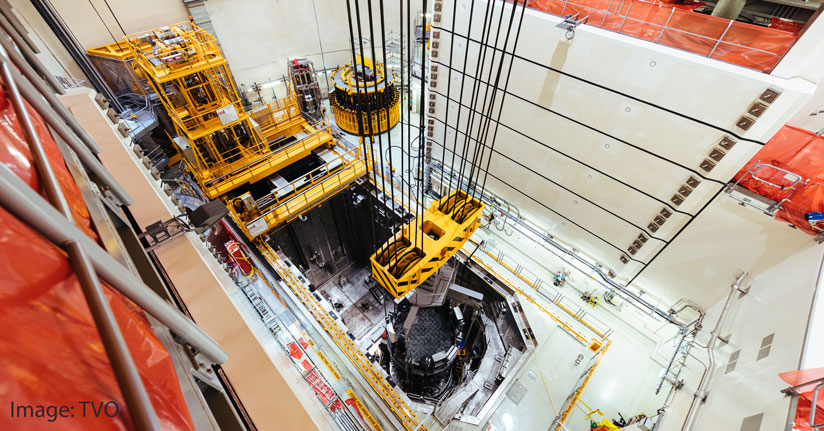
The Olkiluoto 3 nuclear power plant by Teollisuuden Voima Oyj is the largest electricity generating unit in Europe. It is also the first nuclear power plant to have acquired Wedge.
“In a nuclear power plant, safety and reliability are paramount. A nuclear power plant generates a lot of process data, and it must be quick and easy to study the data. Wedge makes this possible. Wedge also accelerated our commissioning tests,” says Jouni Silvennoinen, OL3 Project Director, TVO.
Teollisuuden Voima Oyj (TVO) provides electricity that is produced in a safe, economical, and climate-friendly manner at the Olkiluoto nuclear power plant in Eurajoki. Olkiluoto 3 plays an important role in reaching carbon neutrality by 2035, a goal set by the Finnish government.