Process analysis turns vector data into a fountain of value

Most industrial data analysis is based on time series data. This type of data has one value / process parameter for each time stamp. For example, process automation produces this type of data: measurement values, set-points, control signals, etc. Another common analysis type is event or transactional data analysis where values are linked to events, which can also have time relation.
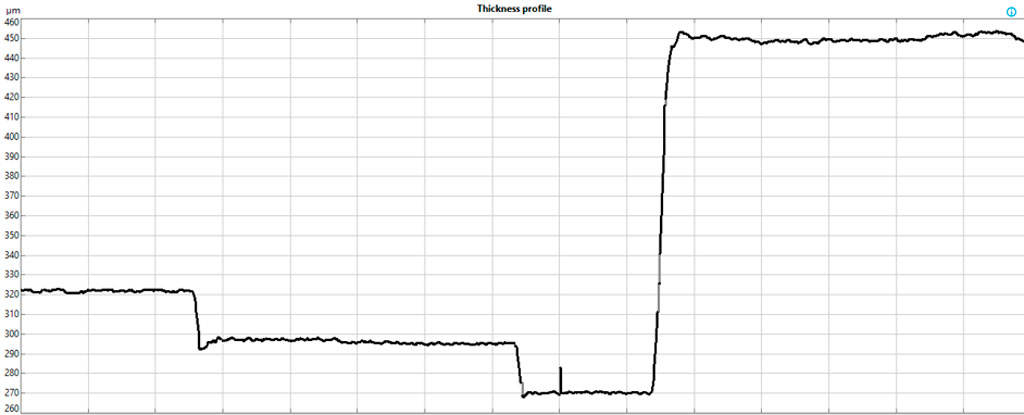
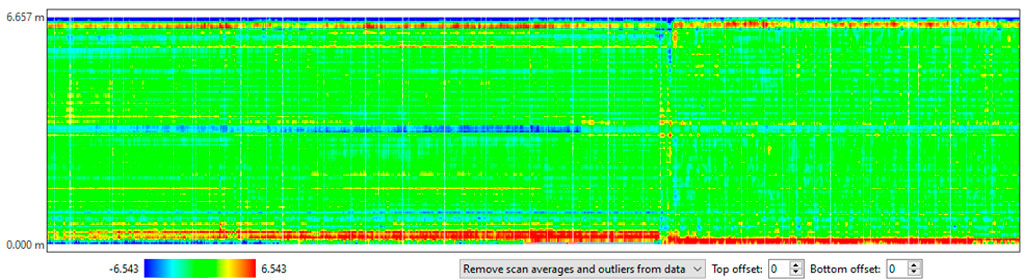
In some types of production or processes, the data by nature is vector data. Most commonly vector data is used to analyse sheet or plate-like products, such as paper or rolled metal. The analyzed data is in vector format and typically produced by profile scanners, inspection cameras, etc. Graphical 2D-profile maps represent the typical approach to visualizing scanner data.
There are more possibilities to utilize vector data than traditional profile measurements. Vector data can be any data that has several data points in the same time stamp. For example, the frequency spectrum can be handled as vectors – each time stamp has a unique frequency spectrum. Or a vector can be a shape extracted from camera systems.
Modern methods and proper tools bring out the value of vector data
Graphical 2D-vector maps represent the typical approach to visualizing vector data. In addition, some statistical value can be presented. Proper tools can reveal high-value information in the vector data sets, such as long-term changes with gradual shifts that cannot be detected through visual monitoring alone. Also, intelligent mathematical data processing can reveal hidden valuable phenomena in data.
What generates the best value is combining vector data with ordinary process information (time series data). Novel methods allow you to diagnose root causes and consequences and relationships between vector and time series / event data.
When analysis methodology and procedures are reliable, fast, and user-friendly, the results are also reliable and obtained fast. This is extremely important, as otherwise the analysis is neglected because of the high workload or because the analysis results may be faulty.
Download the free white paper to learn more!
Download the free white paper that explains how you can combine the analysis of Cross Direction (CD) profiles with process measurements. It also offers some example calculations and the analysis methodology.
 Want more insights?
Our sales team is full of data analysis experts ready to help you. Learn more about Wedge industrial data analytics tool.