Comparing different operating periods with the help of Wedge

One of the most common use cases of Wedge is comparing a period of interest with another time period and figuring out what is done differently. This sort of study is necessary when an engineer wants to determine or optimize the best practices of operating a plant.
Typically, this comparison also reveals whether changing process conditions has a significant impact on process performance, which often triggers further development activities.
CASE 1: A time period compared with a known reference time period
The first week of November last year was a great success: production volumes were high, quality good, and nominal energy consumption lowish.
Since then, your team has been trying to reach the same level of productivity. The last two weeks have been challenging, once again. You would like to understand what you are doing differently now compared to what you did in November.
How do you do that?
With Wedge, you can save reference periods. One saved period can mark your successful test run period, and another could be a benchmark period for producing your end product. A third one might be a period when chemical consumption on your production line was exceptionally low. The saved periods come in handy when you want to compare your current process conditions and operating practices with those in the reference period.
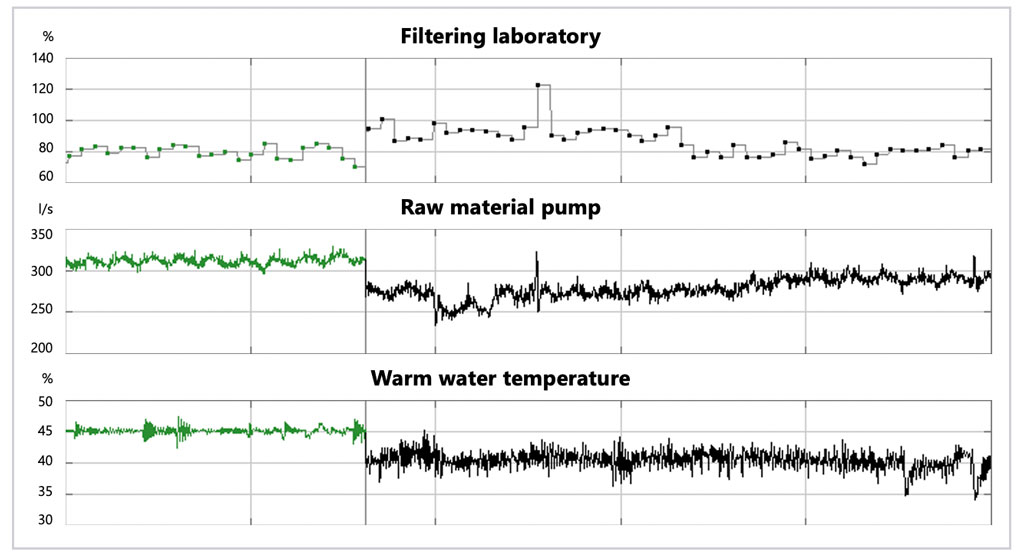
First, you can study how the measurements of interest behave in the target period (black in the figure above), and how they behave during your reference period (green). This is a quick visual study and a good first step in enhancing your understanding.
Next, you could apply mathematics: What are the averages, minimums, maximums, or standard deviations of the selected signals over the selected period and, on the other hand, over the reference period.
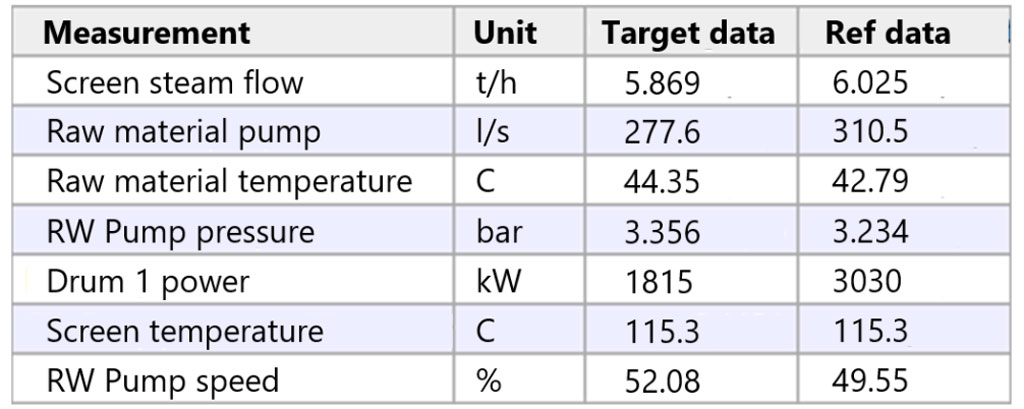
This helps you build an understanding of where the significant differences are.
Finally, you can ask Wedge to list all signals with a remarkable deviation between the selected period and the reference period. The system will return a comprehensive list of measurements in order of the magnitude of the detected change. As this method takes into account all signals, no change between the target and the reference period remains unnoticed.
CASE 2: A period of low productivity compared with a period of high productivity
Your most critical production KPI is tonnes per hour. Based on your experience, 17.5t/h is a laudable performance, whereas less than 15t/h is at an unacceptable level in the long run. You may want to analyze what is done differently when the magical 17.5t/h is reached, and what factors typically explain low tonnages.
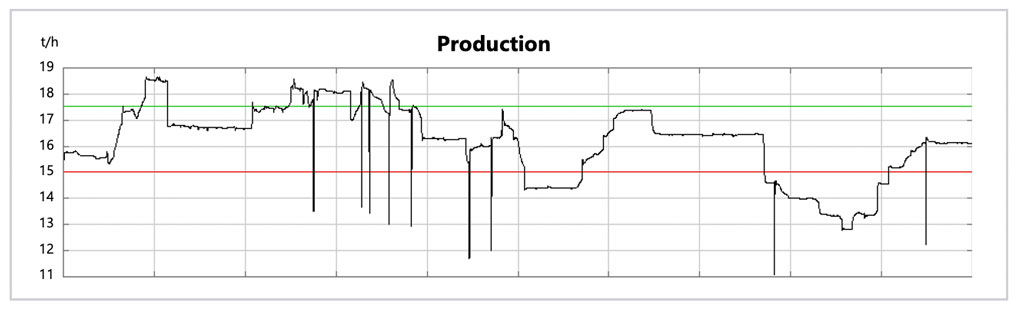
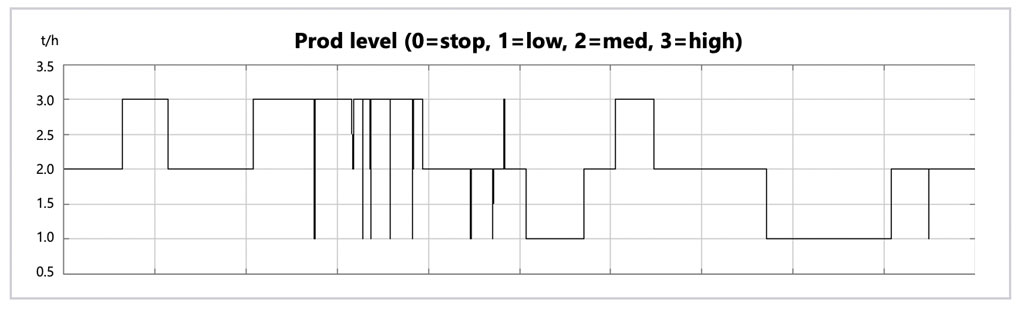
Wedge can convert the production tonnes signal and limits into a stepwise signal that shows whether production has been at a high level (17.5t/h or above), medium level (15-17.5t/h), or low level (15t/h or less). In the figure below, value 3 equals high tonnages, 2 equals medium-level productivity, and 1 equals low productivity. This data can easily be used as the basis for analysis.
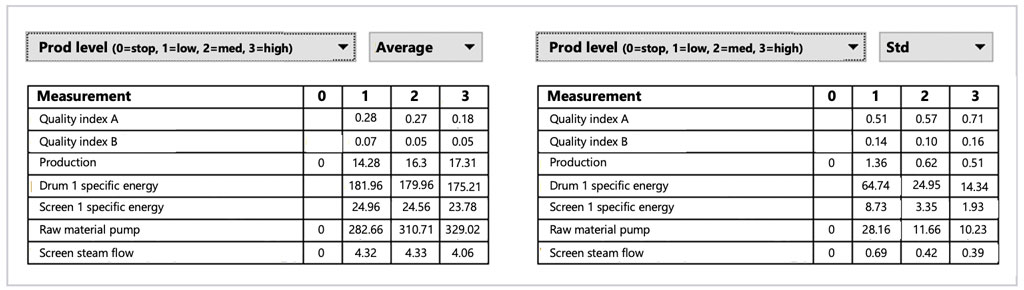
Using the standard filtering features of Wedge, you can start by checking the averages and standard deviations of the process values per production tonnage level.
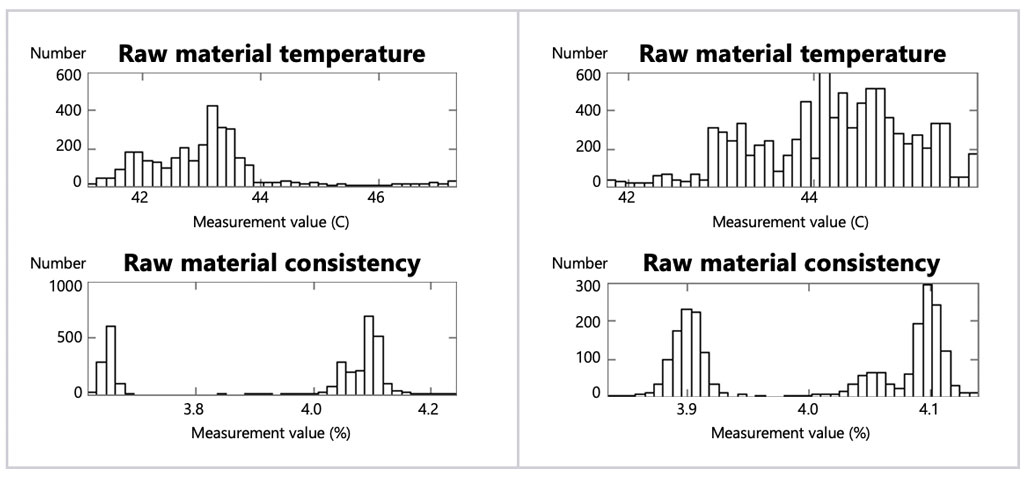
After that, it is possible to continue the analysis using a full set of Wedge’s other analysis tools. For example, in this case, histograms of raw material temperature and raw material consistency (low production on the left, high on the right) reveal clear differences in process conditions between the high and low productivity periods.
CASE 3: An exceptional period compared with the normal state of the process
You detect a time period where something has been different. How do you find out what changes in process conditions or operating methods could explain the negative or positive deviation from the normal?
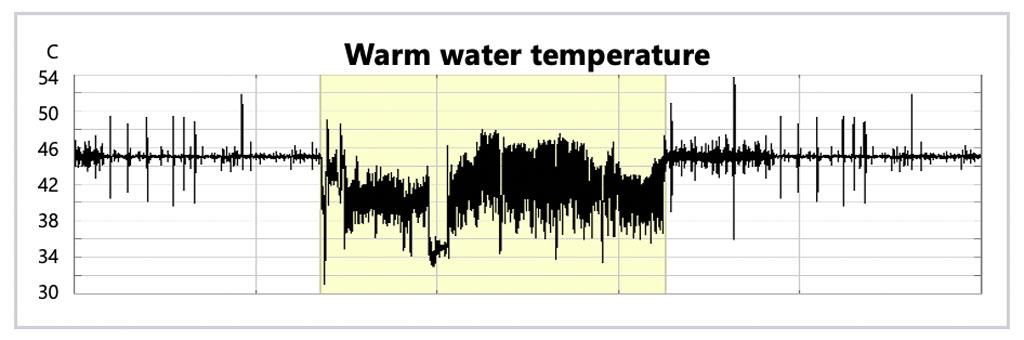
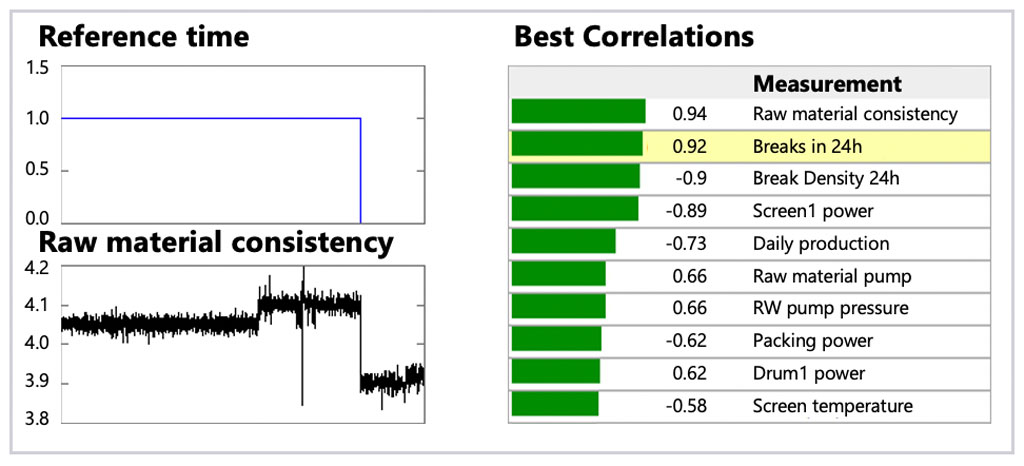
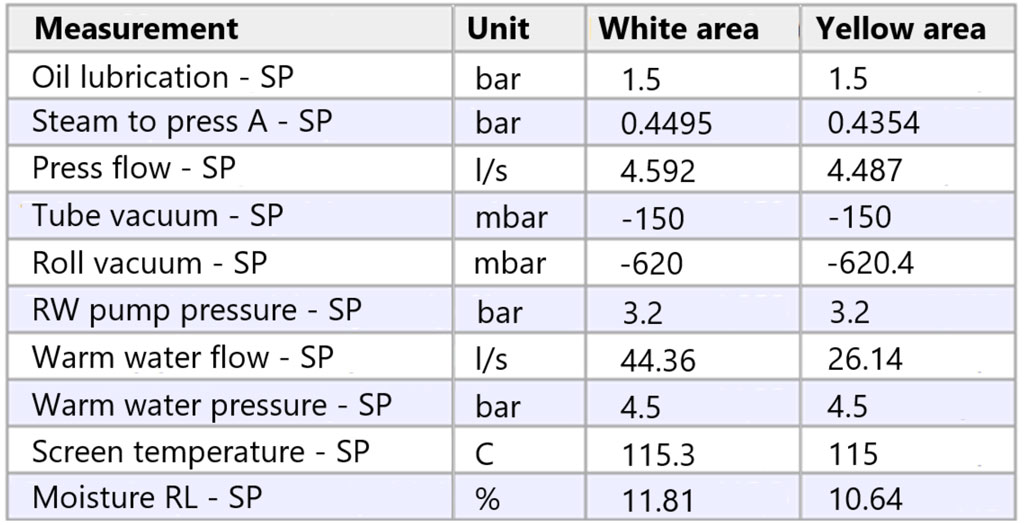
For example, in this case example, you notice that the temperature of warm water has been unstable. In Wedge, you can mark the period of interest with yellow highlight color. By contrast, the surrounding white area indicates the normal state of the process.
With Wedge, you can compare the highlighted area with the normal state. Statistical methods are a good way to start – in the table below, we have calculated the average value of each process setpoint. This shows quickly which operating parameters have changed. The statistical method can naturally be applied to any process or quality measurement, and the results are not limited to averages but can also be minimum or maximum values, standard deviations, etc.
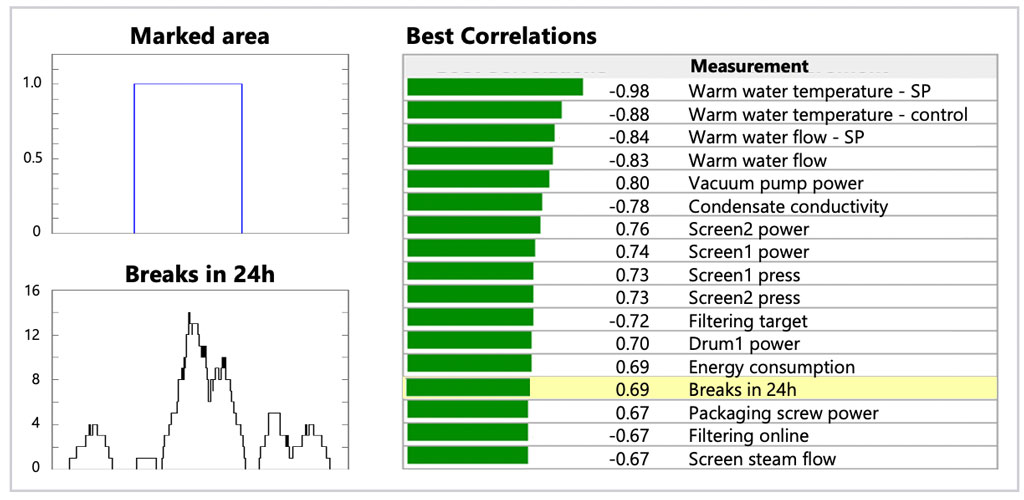
Another approach to tracing differences in setpoints or process conditions is Wedge’s best correlation tool. The tool returns a list of signals with the largest deviation between the normal and the exceptional period. This can be considered a candidate list for explaining the exceptional period. In addition to the root causes, it will also list the consequences of the abnormality.
Comparisons of different time periods and process statuses are the starting point when trying to find the best operating practices and aiming at better performance. It is crucial that the applied systems support efficient workflow and enable you to find phenomena in a large dataset.
 Want more insights?
Our sales team is full of data analysis experts ready to help you. Learn more about Wedge industrial data analytics tool.