Ahlstrom-Munksjö expands its Wedge use to Finland
Ahlstrom-Munksjö’s Karhula mill in Finland has chosen Wedge as a plant-wide online data analytics platform. Ahlstrom-Munksjö’s mills in Italy and Brazil have been satisfied Wedge customers for several years already.
“Our problem was data sharing. There was a lot of data, but managing it was slow and cumbersome. I wish I had known earlier that such a system existed.”
– Anssi Kokko, Manufacturing Process Engineer
Read more about Ahlstrom-Munksjö’s experiences with Wedge >>
Now available: Wedge 9.1
A new, more versatile version of the Wedge process analytics tool is now available.
One of the most welcome features of Wedge 9.1 is DSA, or Data-Stream Analysis, which opens up a whole new world of possibilities for exploiting process data streams.
In addition, the update brings more than 80 other features and usability improvements to make your work easier.
Process analysis turns vector data into a fountain of value

Most industrial data analysis is based on time series data. This type of data has one value / process parameter for each time stamp. For example, process automation produces this type of data: measurement values, set-points, control signals, etc. Another common analysis type is event or transactional data analysis where values are linked to events, which can also have time relation.
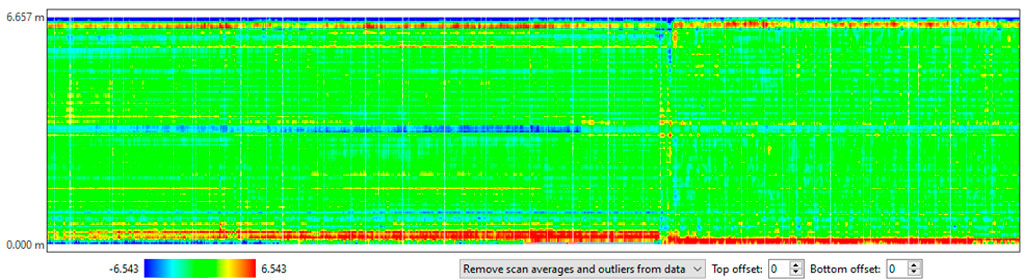
In some types of production or processes, the data by nature is vector data. Most commonly vector data is used to analyse sheet or plate-like products, such as paper or rolled metal. The analyzed data is in vector format and typically produced by profile scanners, inspection cameras, etc. Graphical 2D-profile maps represent the typical approach to visualizing scanner data.
There are more possibilities to utilize vector data than traditional profile measurements. Vector data can be any data that has several data points in the same time stamp. For example, the frequency spectrum can be handled as vectors – each time stamp has a unique frequency spectrum. Or a vector can be a shape extracted from camera systems.
Modern methods and proper tools bring out the value of vector data
Graphical 2D-vector maps represent the typical approach to visualizing vector data. In addition, some statistical value can be presented. Proper tools can reveal high-value information in the vector data sets, such as long-term changes with gradual shifts that cannot be detected through visual monitoring alone. Also, intelligent mathematical data processing can reveal hidden valuable phenomena in data.
What generates the best value is combining vector data with ordinary process information (time series data). Novel methods allow you to diagnose root causes and consequences and relationships between vector and time series / event data.
When analysis methodology and procedures are reliable, fast, and user-friendly, the results are also reliable and obtained fast. This is extremely important, as otherwise the analysis is neglected because of the high workload or because the analysis results may be faulty.
Download the free white paper to learn more!
Download the free white paper that explains how you can combine the analysis of Cross Direction (CD) profiles with process measurements. It also offers some example calculations and the analysis methodology.
 Want more insights?
Our sales team is full of data analysis experts ready to help you. Learn more about Wedge industrial data analytics tool.
Comparing different operating periods with the help of Wedge

One of the most common use cases of Wedge is comparing a period of interest with another time period and figuring out what is done differently. This sort of study is necessary when an engineer wants to determine or optimize the best practices of operating a plant.
Typically, this comparison also reveals whether changing process conditions has a significant impact on process performance, which often triggers further development activities.
CASE 1: A time period compared with a known reference time period
The first week of November last year was a great success: production volumes were high, quality good, and nominal energy consumption lowish.
Since then, your team has been trying to reach the same level of productivity. The last two weeks have been challenging, once again. You would like to understand what you are doing differently now compared to what you did in November.
How do you do that?
With Wedge, you can save reference periods. One saved period can mark your successful test run period, and another could be a benchmark period for producing your end product. A third one might be a period when chemical consumption on your production line was exceptionally low. The saved periods come in handy when you want to compare your current process conditions and operating practices with those in the reference period.
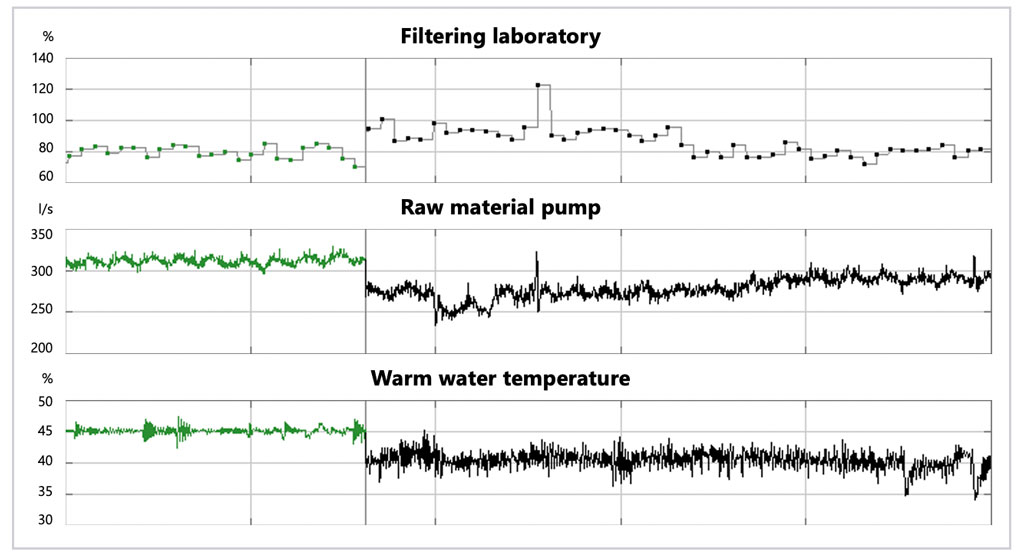
First, you can study how the measurements of interest behave in the target period (black in the figure above), and how they behave during your reference period (green). This is a quick visual study and a good first step in enhancing your understanding.
Next, you could apply mathematics: What are the averages, minimums, maximums, or standard deviations of the selected signals over the selected period and, on the other hand, over the reference period.
This helps you build an understanding of where the significant differences are.
Finally, you can ask Wedge to list all signals with a remarkable deviation between the selected period and the reference period. The system will return a comprehensive list of measurements in order of the magnitude of the detected change. As this method takes into account all signals, no change between the target and the reference period remains unnoticed.
CASE 2: A period of low productivity compared with a period of high productivity
Your most critical production KPI is tonnes per hour. Based on your experience, 17.5t/h is a laudable performance, whereas less than 15t/h is at an unacceptable level in the long run. You may want to analyze what is done differently when the magical 17.5t/h is reached, and what factors typically explain low tonnages.
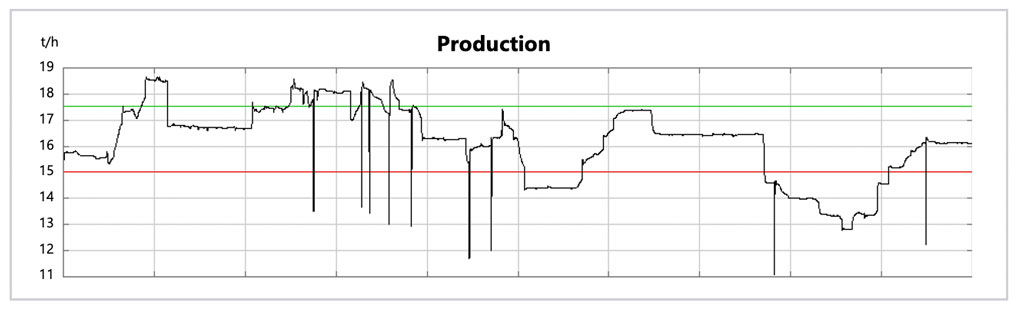
Wedge can convert the production tonnes signal and limits into a stepwise signal that shows whether production has been at a high level (17.5t/h or above), medium level (15-17.5t/h), or low level (15t/h or less). In the figure below, value 3 equals high tonnages, 2 equals medium-level productivity, and 1 equals low productivity. This data can easily be used as the basis for analysis.
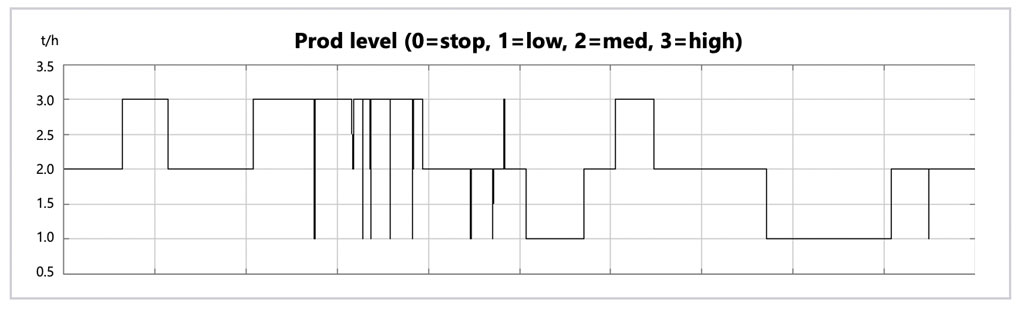
Using the standard filtering features of Wedge, you can start by checking the averages and standard deviations of the process values per production tonnage level.
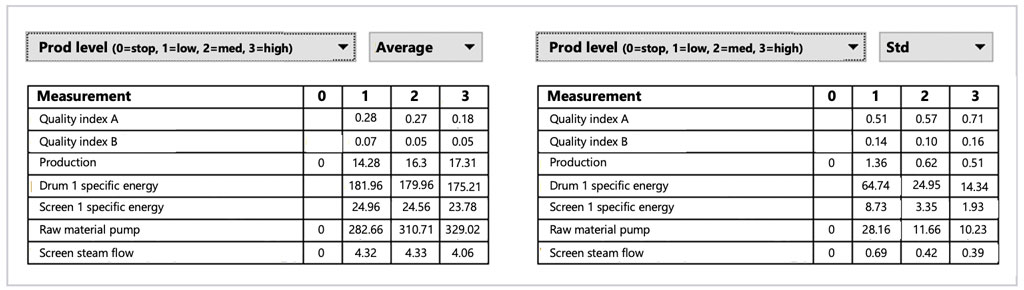
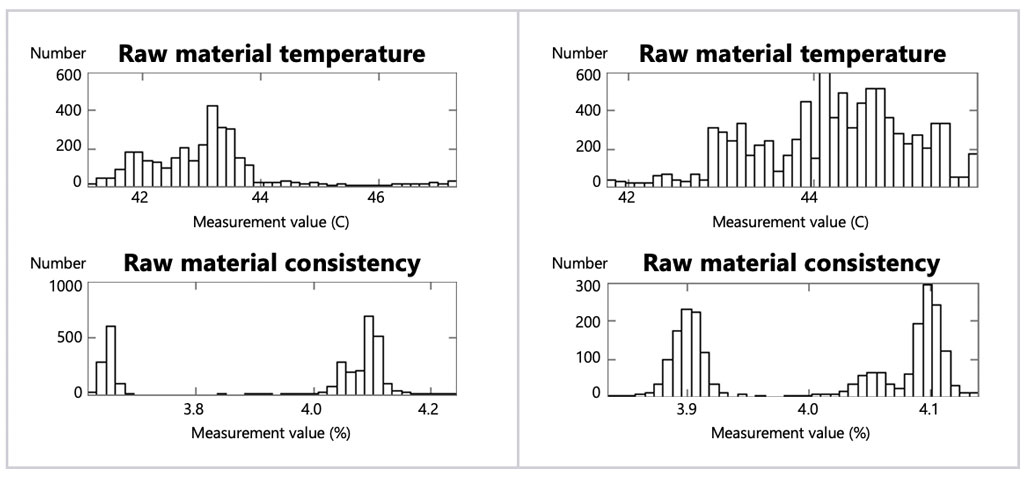
After that, it is possible to continue the analysis using a full set of Wedge’s other analysis tools. For example, in this case, histograms of raw material temperature and raw material consistency (low production on the left, high on the right) reveal clear differences in process conditions between the high and low productivity periods.
CASE 3: An exceptional period compared with the normal state of the process
You detect a time period where something has been different. How do you find out what changes in process conditions or operating methods could explain the negative or positive deviation from the normal?
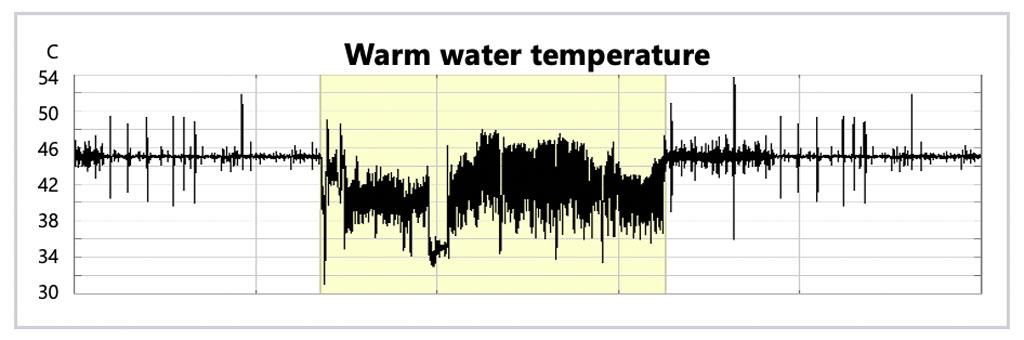
For example, in this case example, you notice that the temperature of warm water has been unstable. In Wedge, you can mark the period of interest with yellow highlight color. By contrast, the surrounding white area indicates the normal state of the process.
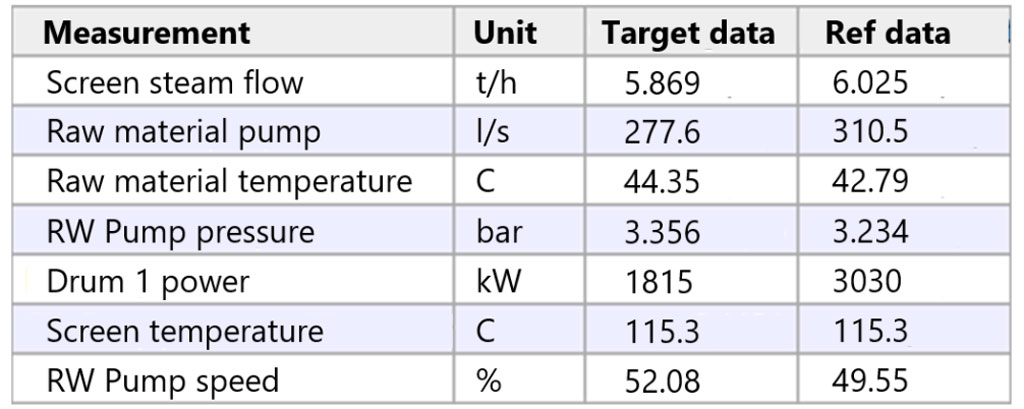
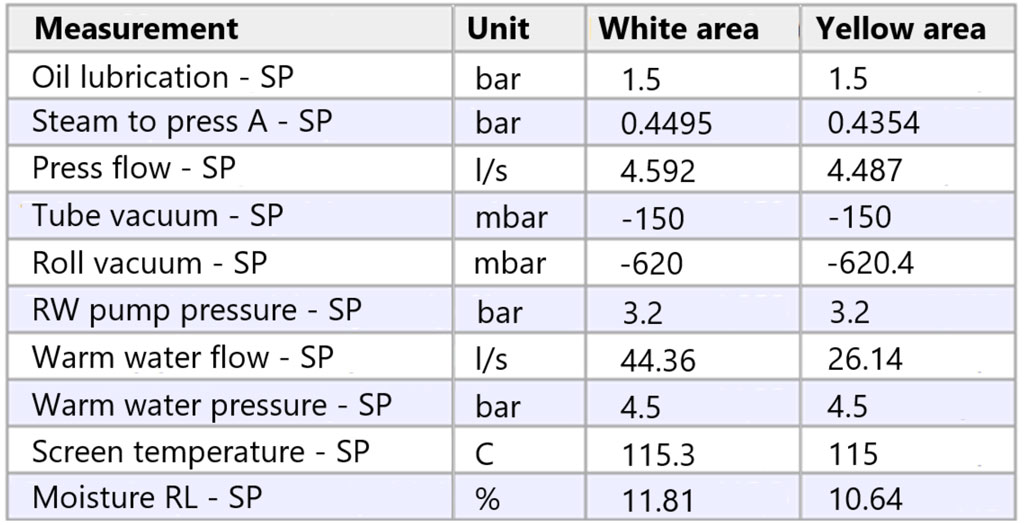
With Wedge, you can compare the highlighted area with the normal state. Statistical methods are a good way to start – in the table below, we have calculated the average value of each process setpoint. This shows quickly which operating parameters have changed. The statistical method can naturally be applied to any process or quality measurement, and the results are not limited to averages but can also be minimum or maximum values, standard deviations, etc.
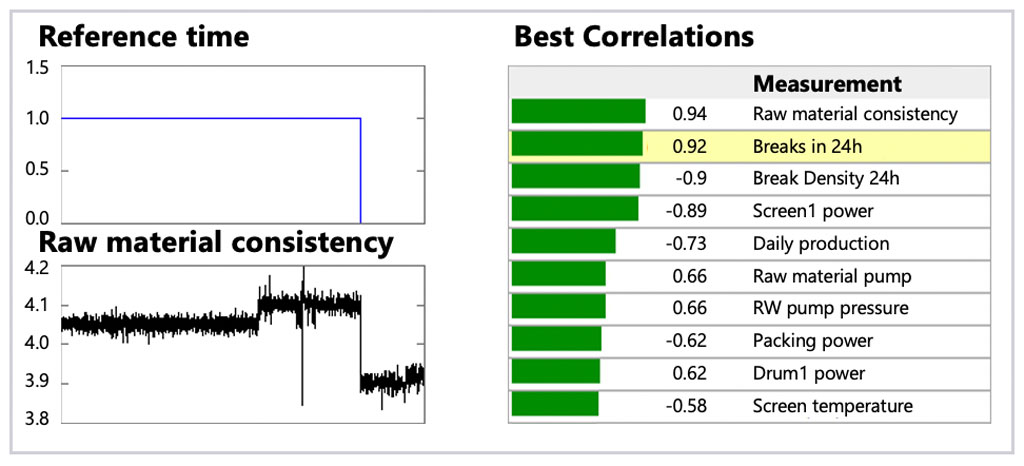
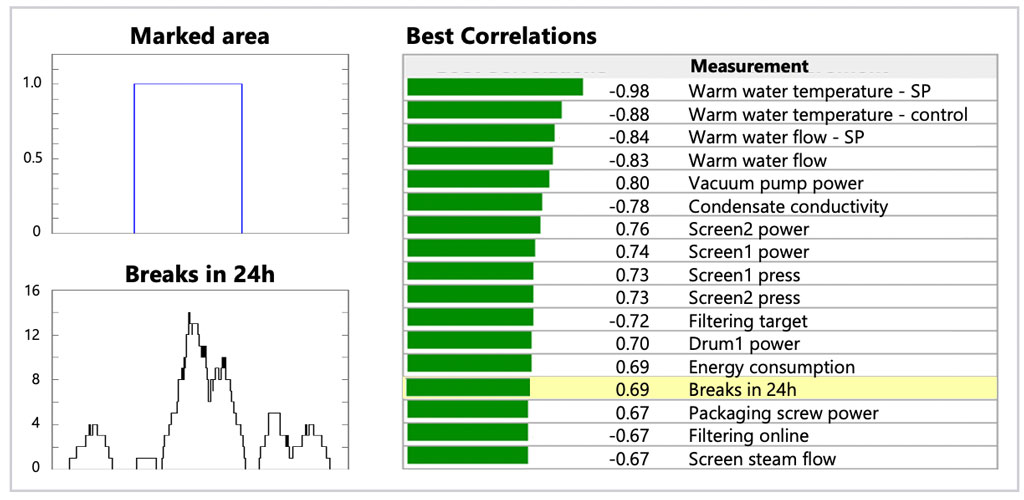
Another approach to tracing differences in setpoints or process conditions is Wedge’s best correlation tool. The tool returns a list of signals with the largest deviation between the normal and the exceptional period. This can be considered a candidate list for explaining the exceptional period. In addition to the root causes, it will also list the consequences of the abnormality.
Comparisons of different time periods and process statuses are the starting point when trying to find the best operating practices and aiming at better performance. It is crucial that the applied systems support efficient workflow and enable you to find phenomena in a large dataset.
Want more insights?
Our sales team is full of data analysis experts ready to help you. Learn more about Wedge industrial data analytics tool.
Holmen expands its Wedge use to Sweden
Holmen Iggesund Paperboard’s mill in Sweden has chosen Wedge as a plant-wide online data analytics platform. Holmen Iggesund’s sister mill in Workington has been a satisfied Wedge customer for over a year now.
“Wedge has given us easy access to our process and product data. It is also a powerful tool for analyzing process data. This helps us in troubleshooting and working with process improvements and product development. Furthermore, it has made us aware of the importance of data quality, which is the foundation of and the key to our way forward working with digitalization and becoming a Smart Site.”
– Peder Hägglund, Technical, Project and IT Manager
The Iggesund Mill is one of the world’s most advanced, fully integrated pulp and paperboard factories. The mill has traditions that stretch all the way back to 1685. It is characterized by pride and commitment, and today around 800 people work together to turn the raw material together into world-class renewable packaging.
Four practical case examples of pattern recognition in Wedge

Wedge makes it possible to use advanced algorithms to recognize patterns in process and quality data. Below, we have introduced four practical applications of pattern recognition that help Wedge users to gain a better understanding of cause-and-effect relationships within the process.
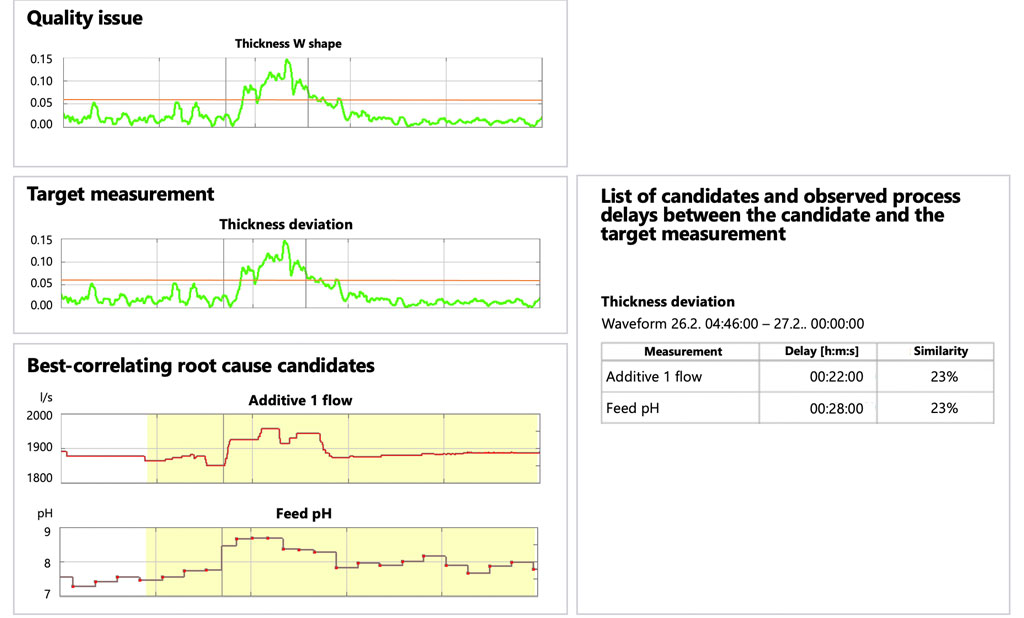
CASE 1: Trace the root cause of a quality issue
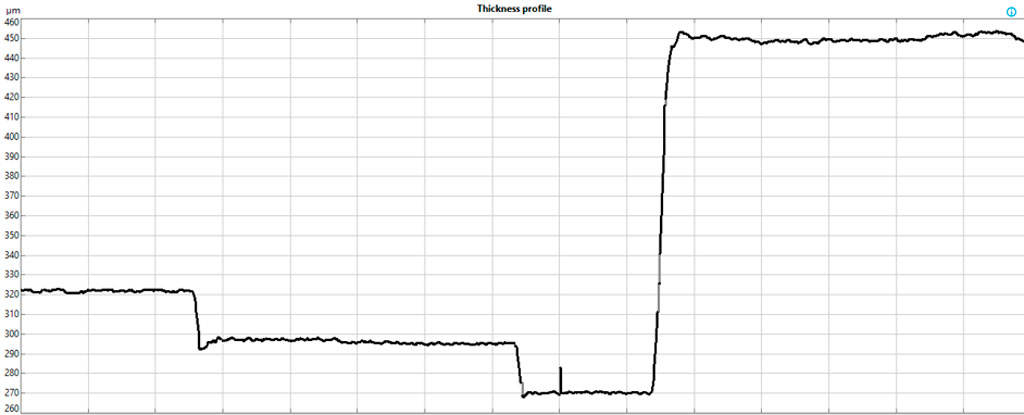
There is a quality issue in your process. Deviation occurs in the thickness of the end product, causing waste and scrap. Your first priority is to understand what the underlying causes are that impact the thickness deviation.
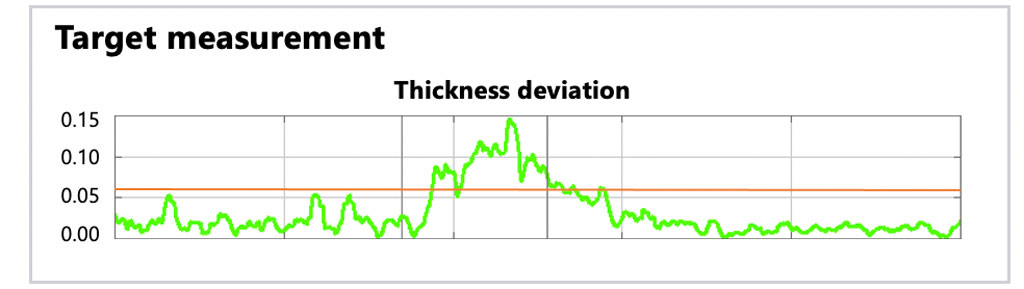
Wedge goes through all the other measurements and finds the ones that have a similar or mirror pattern at the same time or before the thickness deviation. As a result, the Wedge system lists the root cause candidates for the quality issue.
As a Wedge user you do not have to worry about possible process delays, since the pattern recognition tool compensates for them automatically.
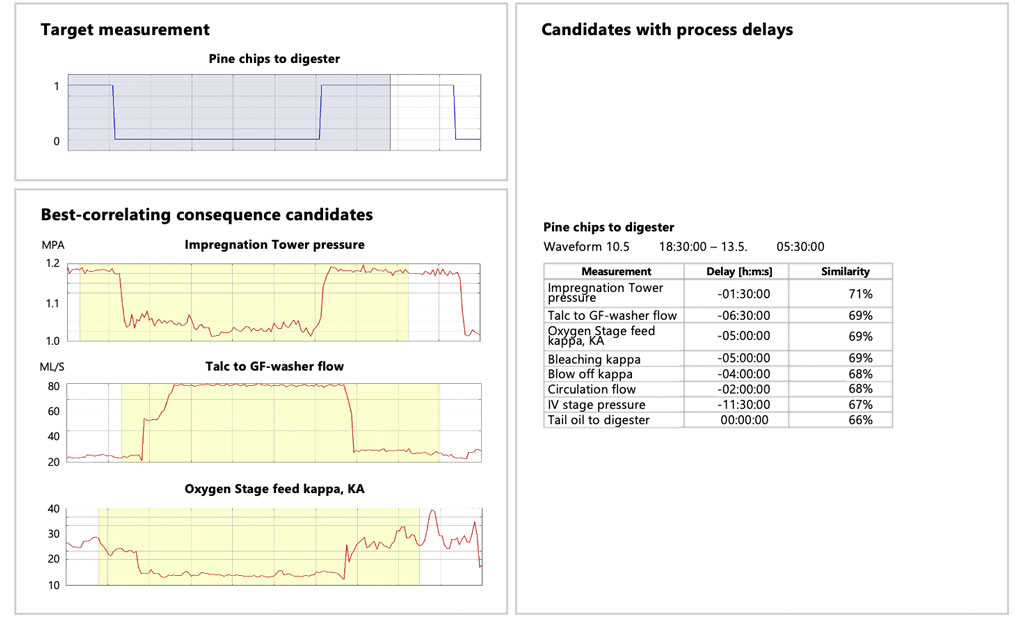
CASE 2: Understand the consequences of raw material changes
Changes in raw material may also affect your process. Wedge pattern recognition algorithms can also help you find those.
Wedge compares the shape of the target measurement (the change of raw material from type one to zero, and back to one) to other signals, and lists the best-correlating consequence candidates with regard to the target measurement and process delay.
This is a great way to learn new things about the behavior of the target process.
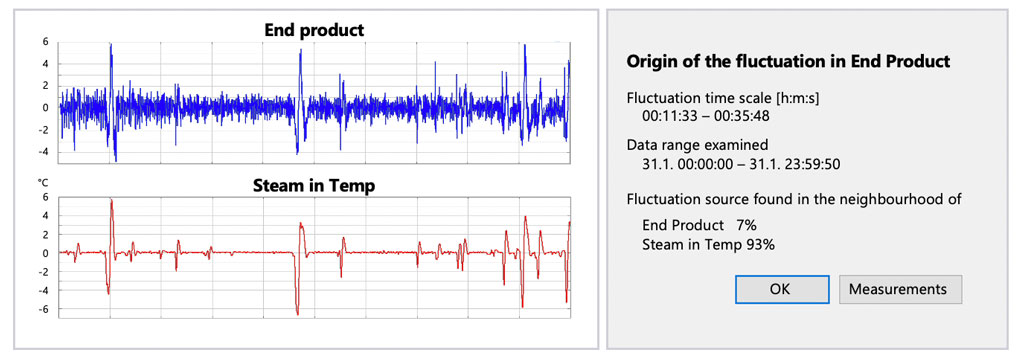
CASE 3: Figure out what causes periodic fluctuations
A single peak in a signal and/or a change in a level are easy patterns to notice and trace. But what if your target measurements fluctuate strongly but it seems to be random? Or the pattern does not look clear or there are several independent patterns having an impact at the same time? Sounds complicated, but with Wedge it is not.
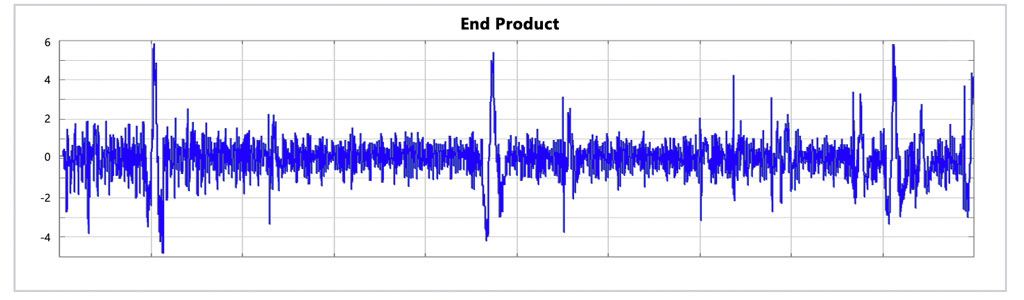
First, Wedge helps you by isolating different patterns from the signal. The system shows what kinds of fluctuation patterns can be found and the relative power of each pattern. In practice, we get to know whether there are periodic fluctuation patterns in the data, what the period lengths of the identified patterns are, and which fluctuation is the strongest.
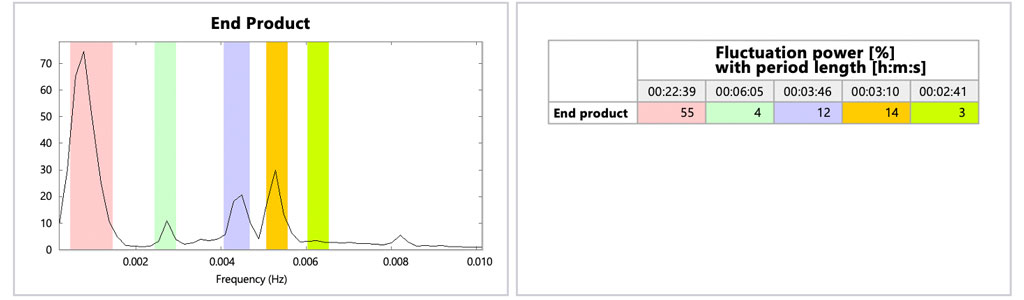
The last step is to diagnose what causes each pattern. For example, you can have Wedge evaluate what causes the strongest fluctuations in the signal (the red one with a period length of 22 min and 39 s). In this example, the data points to the temperature of the incoming steam as the strongest root cause candidate.
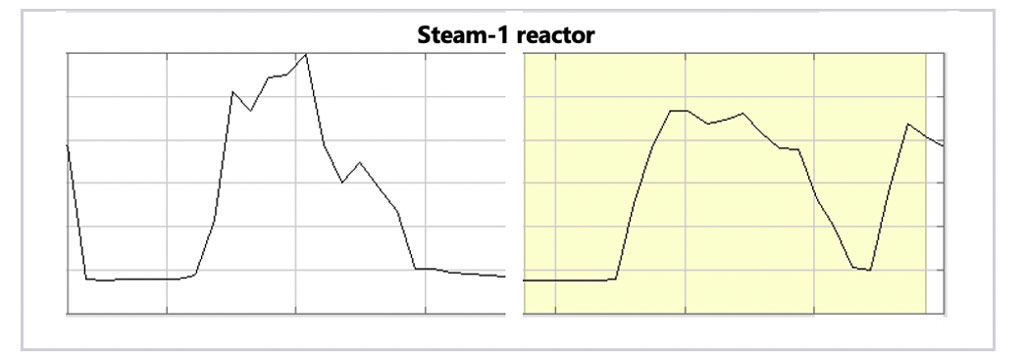
CASE 4: Search for earlier time periods with similarities to the target period
Imagine finding an interesting period of process behavior – let us say, a concentration of an additive chemical is lower than instructed and raw material temperature is in decline. Still, the end product quality remains stable. You might start to think whether such an event or process condition and operating practice has occurred earlier, or if this is a one-off coincidence only.
Wedge will be able to trace different periods in history that have a similar pattern: the same events, process conditions, and/or operating practices as your target period. So, how to trace different periods in history that have patterns – events, process conditions, and/or operating practices – similar to your target period?
Wedge can help you with the task at hand.
You can select the target signal and target pattern behavior. In the picture below, one signal is selected, and the yellow area depicts the period of interest. Wedge studied the history of the signal and found another period when the selected signal behaved in a manner that was relatively similar to the target period. Now you have the main suspects in your hands.
Want more insights?
Our sales team is full of data analysis experts ready to help you. Learn more about Wedge industrial data analytics tool.
Process knowledge and efficient data use are key to energy efficiency

Industry processes traditionally generate a lot of data, but from an energy-efficiency point of view, it may not be relevant data or the right kind of data.
Energy use does not always impact production, so even significant shortcomings in energy efficiency do not necessarily disrupt the core process at a manufacturing plant. Energy guzzlers are easily missed.
How to improve energy efficiency at a production mill
Two things are needed to improve energy efficiency: the right data and expertise in both processes and data handling.
Elomatic offers expertise in both areas. Elomatic combines its measurements with the customer’s data to help the customer make their energy use more efficient. Jukka Summanen, Leading Expert and Development Manager at Elomatic describes the challenges of data use:
The customer may have collected a lot of data but is not sure how to make the best use of it. Usually, the data needs to be cleansed and sorted to really make it useful. Process knowledge is key to sensible and reliable data analysis. Without process knowledge, data is useless.”
Handling energy data is a broader process than handling process data
Process data is often handled from the point of view of production, to improve production efficiency or by investigating an individual problem and its root causes. When energy data is analyzed, the data mass is often larger and it is monitored over a longer time, for example, a year. The data can be analyzed against other variables, such as weather changes. Energy data analysis also makes use of statistical and range analyses.
One important measure is energy balance, which reveals how much energy enters the plant, how it is consumed, and how much energy leaves the plant unutilized.
Unlock the power of Wedge for industrial data analytics
The benefits of energy efficiency
Simple discoveries often result in significant savings. Proper data analysis can help track devices that are on for no reason, oscillating process controls, or malfunctioning heat transfer devices, for example.
Refining energy consumption data into information about specific types of consumption helps track and develop energy efficiency from a type-specific viewpoint. This makes it possible to obtain product or batch-specific information about environmental effects, which creates a premise for setting carbon neutrality goals.
In the future, it will be easier to predict status and efficiency in production, but this requires that the right data is collected and analyzed with competence.
Using the right tool increases efficiency significantly
An efficient and easy-to-use data analytics system makes process analysis easier and produces better-quality analyses. It enables companies to make changes that improve energy efficiency based on knowledge, not guesswork.
The tool of choice for Elomatic is Wedge, Trimble’s process diagnostics tool.
Team Leader for Efficiency Solutions at Elomatic, Jussi Jääskeläinen, explains why:
If we could go by trends alone, we would not need Wedge, but in our line of work it is essential that we can sort data by a specific quality or time period. What is more, it is quick; you can do it with one click. Other products cannot do that.”
The stages of improving energy efficiency
This is how you can improve energy efficiency in your own company:
- Make sure you are measuring the right things
- Monitor the measurements and energy balance over a long time period, such as a year
- Cleanse and sort the collected data, and analyze the results
- Use the data to establish monitoring for significant energy consumers, with target values
- React to anomalies, make the required plans and execute them
Want more insights?
Our sales team is full of data analysis experts ready to help you. Learn more about Wedge industrial data analytics tool.
The most common user scenarios for data analytics with Wedge

When we categorized the most common Wedge user scenarios, the following cases came up. Different user scenarios are usually linked together; for example, the situation awareness view also includes the possibility to drill down into very detailed analysis.
Situation awareness | Know exactly what is happening in your processes
Wedge offers ready-made views for situation checks with just one click.
- Diagrams & Dashboards
- Center Lining
- Predictions & Forecasts
- Standard views
- Morning meetings
- Shift change meetings
- Hop-in to the control room for “what’s up”
Ad-hoc need for process data | Get fast facts to support your decision making
Simple and fast data retrieval, cleansing, and analysis – the basics of Wedge use.
- In the middle of a meeting
- In process operations when something is abnormal
- In process operations: how we did it earlier
- In process operations: when I change this parameter, what are the consequences
Optimization and development | Learn how to improve processes and operations
Process status comparisons and analysis are easy to do with Wedge.
- What is the difference between a good and bad operation window?
- Finding best practices
- What are the effects of bad practices?
Deep analysis | Find the root causes even in the tricky cases
Data analysis-driven projects benefit from Wedge.
- Development projects
- Troubleshooting project
Read more about how widely Wedge is used at different mill sites >>
Want more insights?
Our sales team is full of data analysis experts ready to help you. Learn more about Wedge industrial data analytics tool.
Why process analytics with Wedge is so popular at mill sites

It is an outdated belief that data utilization is the job of only a group of dedicated people, like development engineers. With a well-designed diagnostics tool, process data analytics is (almost) for everyone.
Wedge is a well-known process data analysis and diagnostics system that has been in use for over 25 years. It is designed to serve a broad range of different user groups from process operators to mill managers and to help in various use cases.
So, it took us by surprise when one of our customers once told us that their mill site only has a handful of Wedge users because they don’t have that many data experts in-house to do data analysis. We are great believers in facts, so we checked our user statistics to see whether that is really the case.
Average of 50 active Wedge users per mill site
Based on data gathered from 25 different mills, the number of weekly active users varied from 10 to over 100 users per site, with the average number being 50 active users per site. This was even higher than we expected, and we were left thinking that there must be ways to utilize Wedge that even we are not aware of. Naturally, we wanted to find out in more detail what the common, and even the more unconventional, Wedge user scenarios are.
It is incredible that people do data analysis without even noticing that what they are doing is data analysis.
While studying the issue, we came across various comments underlining the fact that Wedge has increased data usage and democratized analytics.
With the help of Wedge, people select data, refine it, and run statistical comparisons with no hesitation at all. The more the culture at mills encourages data-driven decision making, the faster people adopt the Wedge system.
Read more about the most common user scenarios for data analytics with Wedge >>
Want more insights?
Our sales team is full of data analysis experts ready to help you. Learn more about Wedge industrial data analytics tool.
We are hiring: Development Engineer

We are looking for a new member to our Wedge team in Espoo, Finland.
If you can see yourself as our new Development Engineer developing our process diagnostics system Wedge as well as Wedge related new applications, especially distributed Big Data acquisition, Storage and handling Tools and Applications, don’t wait too long but apply now.