Mastering intuitive data refinement
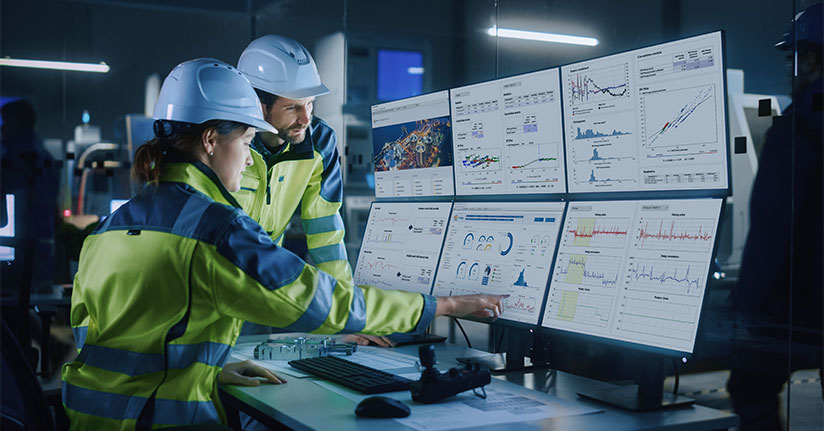
As highlighted in “Beyond the Dashboard: Why data analysis demands personalization” raw data rarely yields reliable analysis. Real-world process data is noisy, fragmented, and full of interruptions, and is often…
MEL Paper has selected Trimble Wedge to improve its use of process data
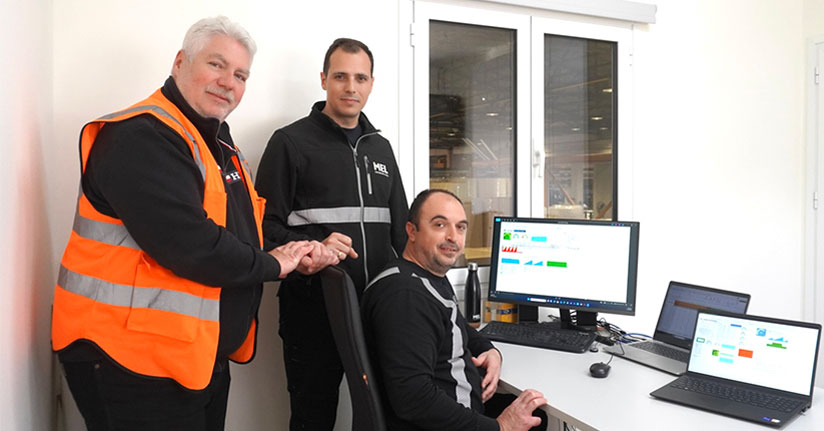
MEL Paper is the largest recycling‑based paper and cartonboard manufacturer in Greece and one of the most significant players in Southeastern Europe, producing recycled paperboard for packaging applications since 1967….
SharpCell expands Wedge use to new Tervasaari plant
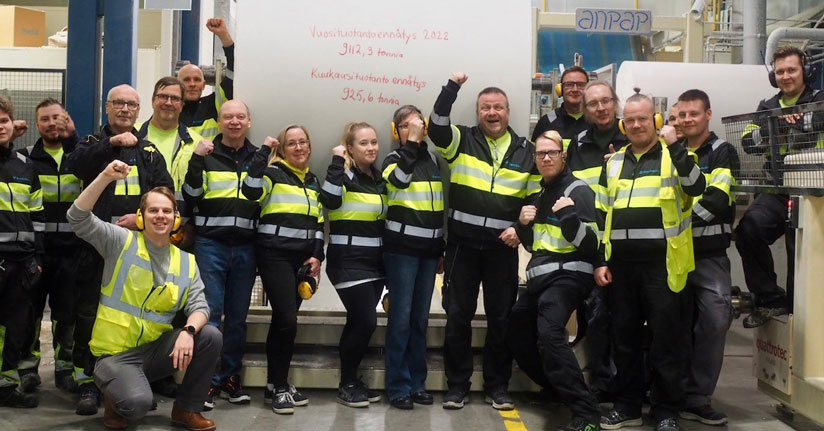
SharpCell, a prominent airlaid manufacturer based in Finland, is set to enhance its production capabilities by integrating the process data analytics system Wedge into its new plant in Tervasaari. This…
Beyond the dashboard: Why data analysis demands personalization

Conventional data systems are designed for automated analysis, predefined workflows and dashboards for routine monitoring and reporting. They are good, but not sufficient for real-life troubleshooting, which is complex and…
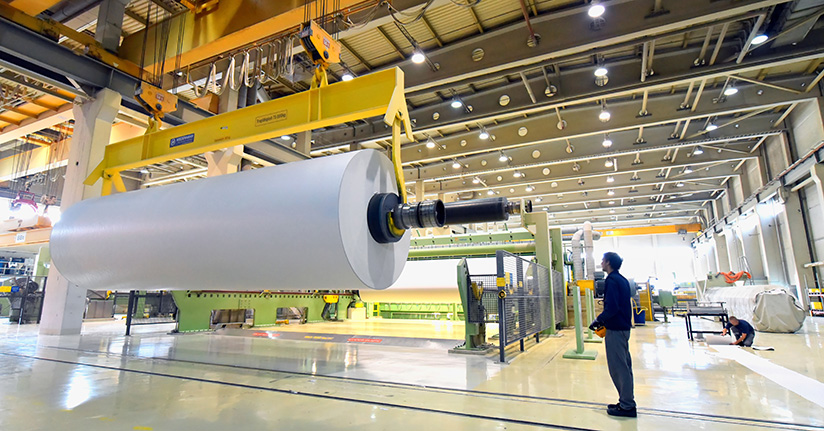
Enhancing Paper Quality Through Integrated Data Analytics

In the fiercely competitive paper industry, consistent, high-quality paper isn’t just a goal—it’s the bedrock of profitability and customer satisfaction. However, traditional methods of monitoring paper quality often fall short,…
Innovative Data Analytics in the Paper Industry: Balancing Ad Hoc Insights with Automated Consistency
The pulp and paper industry is constantly evolving, driven by the need to optimize processes and uphold high-quality standards. As traditional methods of data monitoring struggle to keep pace with…
Join Us at MIAC 2025!
Trimble Wedge is proud to sponsor MIAC 2025, the premier event for the paper and packaging industry in Italy. The conference will be held in Lucca from October 8 to…
Billerud Gävle selects Wedge
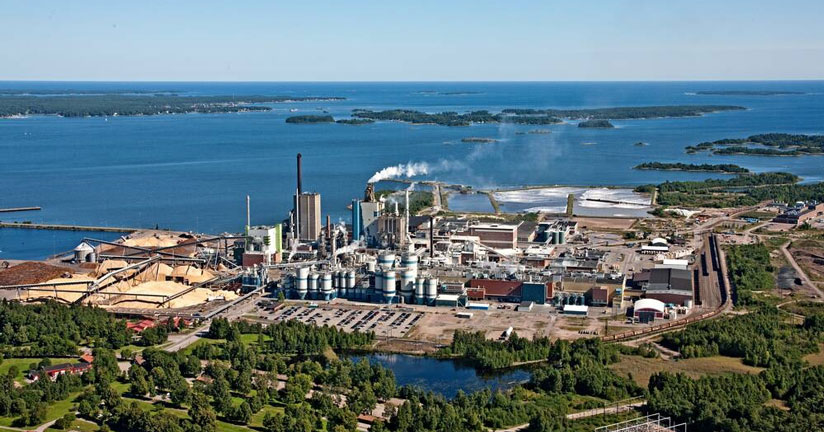
Billerud’s production unit in Gävle, Sweden, renowned for producing liquid packaging board and white-top liners for food-proof packaging solutions, has chosen Wedge to support consistent quality and efficiency in its…
Join us at two key industry events in July
We are excited to present Wedge at two significant industry events this July. Join us at Zellcheming in Wiesbaden, Germany, from July 1-3, and Congresso Nacional da Bioenergia in Araçatuba,…
Let’s meet at TAPPICon 2025 in Minneapolis!
We are thrilled to announce our participation in TAPPICon 2025, the premier conference for sustainable forest product producers, taking place in Minneapolis, MN, from May 4th to May 7th, 2025….