Spectrum Analysis & Diagnosis
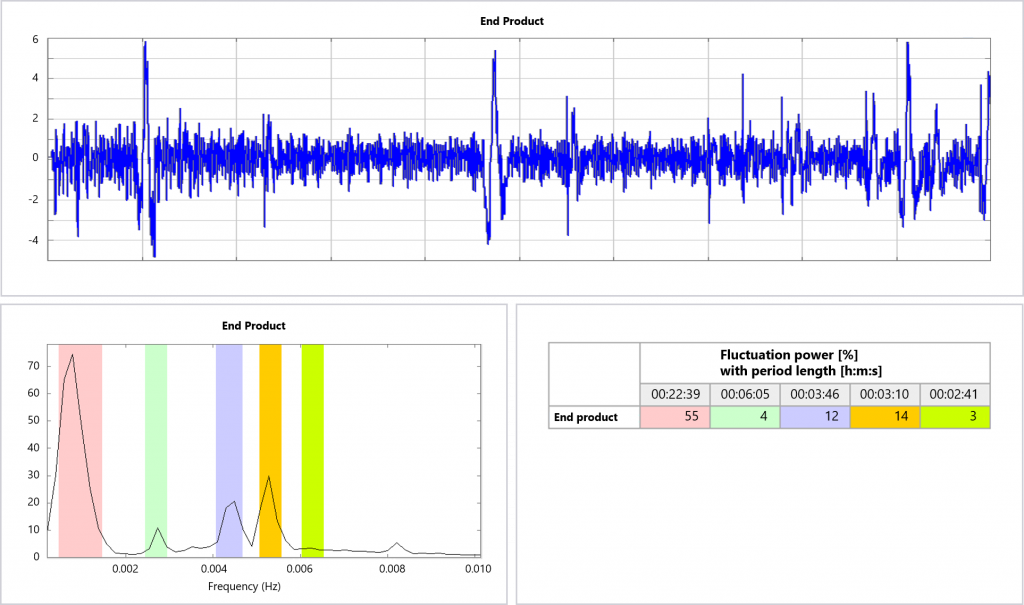
A frequency spectrum is a graphical process-data display format that is used to interpret measurement-signal cycles and to display the distribution of fluctuations in the measured signal across various frequencies. It can be used to distinguish among simultaneous phenomena on the basis of cycle length.
These spectra are especially useful when the user sees from a trend plot that the measurement data display periodicity, cycles of characteristics. In addition, weak periodic fluctuations can be visualized by means of spectrum visualizations.
Wedge can be utilized to ascertain the cycle lengths, as shown in the picture below.
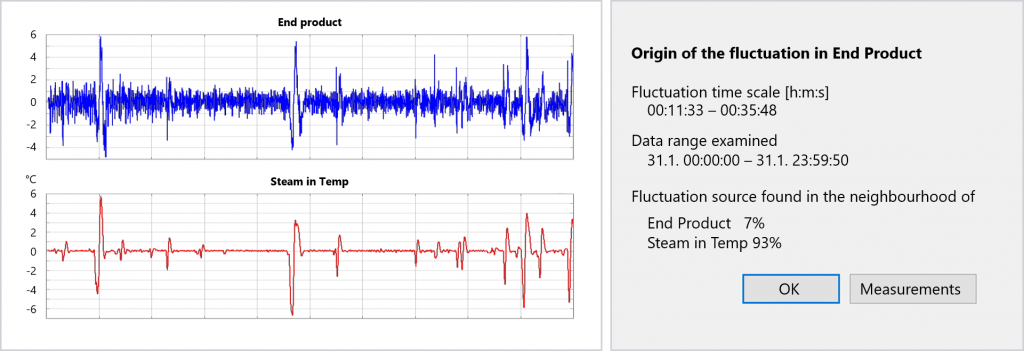
You can diagnose candidates for the root cause of the fluctuations with the aid of Wedge. In this example, the data point to the temperature of the incoming steam as the strongest candidate.
Want to learn more? Contact our sales team!